

Question: Data given!! A through C. 9 A data set is given below. (a) Draw a scatter diagram. Comment on the type of relation that appears
Data given!! A through C. 9
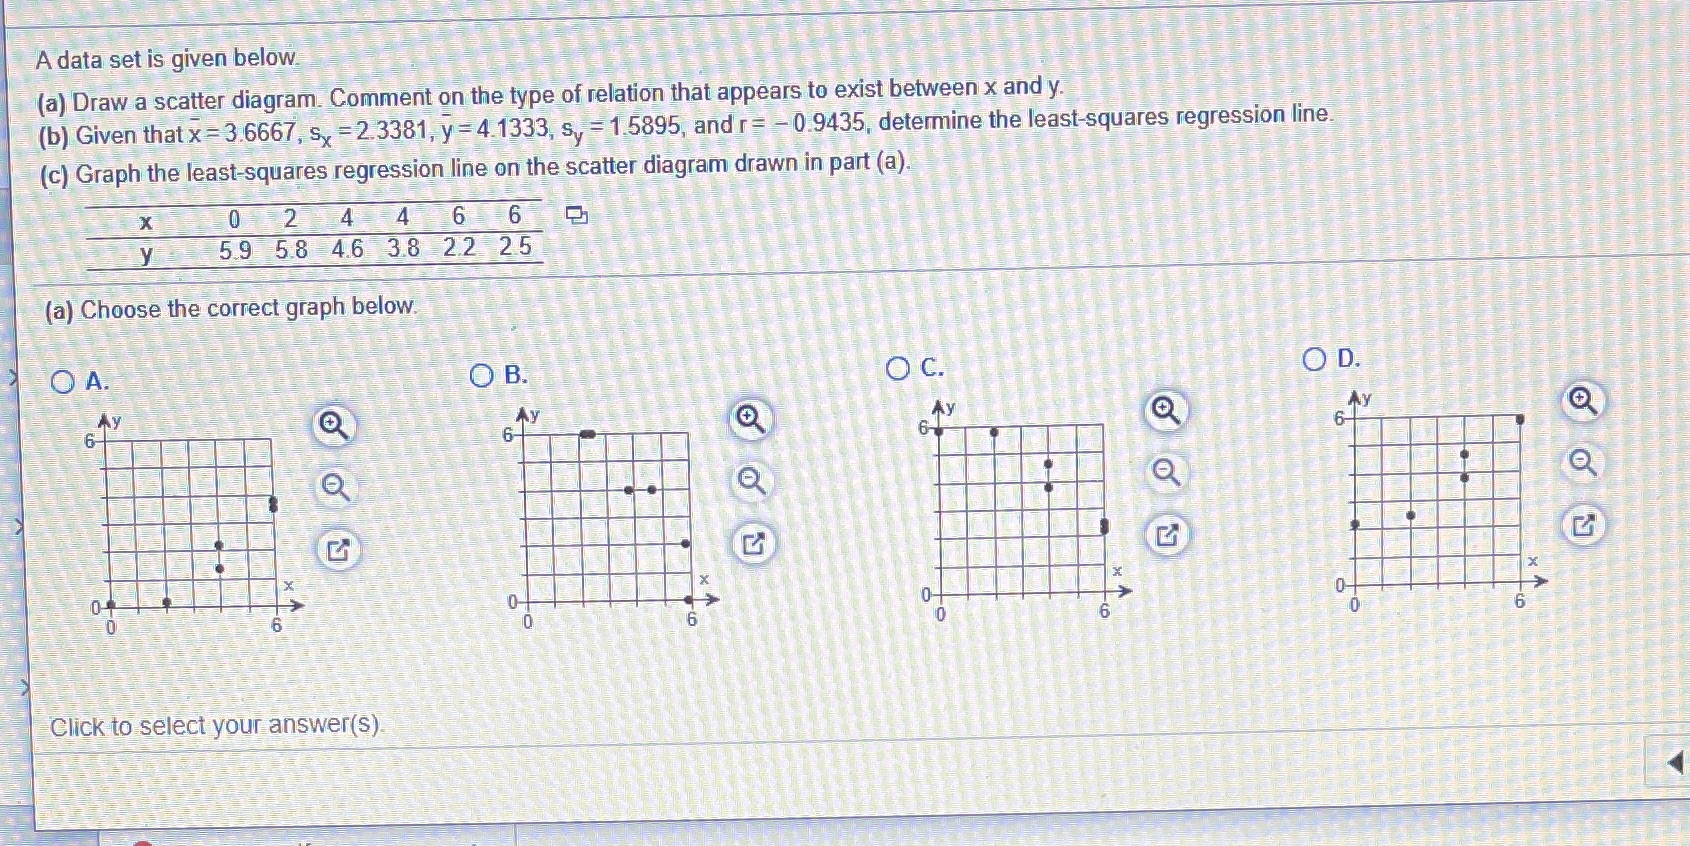
A data set is given below. (a) Draw a scatter diagram. Comment on the type of relation that appears to exist between x and y. (b) Given that x = 3.6667, s =2.3381, y = 4 1333, sy = 1.5895, and r =-0.9435, determine the least-squares regression line (c) Graph the least-squares regression line on the scatter diagram drawn in part (a). X 0 2 4 4 6 6 5 y 59 58 46 38 22 25 (a) Choose the correct graph below. O A. O B. OC. OD. O Ay 67 Ay X X Click to select your answer(s)
Step by Step Solution
There are 3 Steps involved in it
1 Expert Approved Answer
Step: 1 Unlock

Question Has Been Solved by an Expert!
Get step-by-step solutions from verified subject matter experts
Step: 2 Unlock
Step: 3 Unlock