

Question: Data plotted in the graph appear in the table below. 1) Refer to Graph 8.1. What is the average demand for the second period? A)
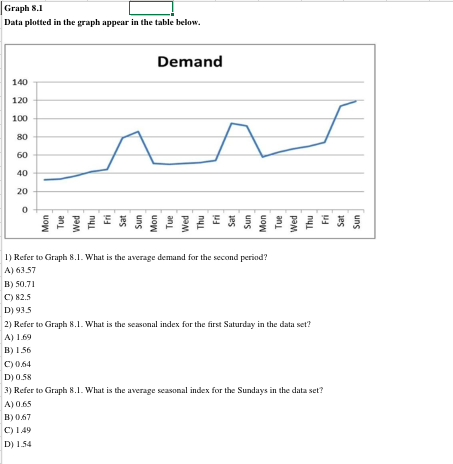
Data plotted in the graph appear in the table below. 1) Refer to Graph 8.1. What is the average demand for the second period? A) 63.57 B) 50.71 C) 82.5 D) 93.5 2) Refer to Graph 8.1. What is the seasonal index for the first Saturday in the data set? A) 1.69 B) 1.56 C) 0.64 D) 0.58 3) Refer to Graph 8.1. What is the average seasonal index for the Sundays in the data set? A) 0.65 B) 0.67 C) 1.49 D) 1.54
Step by Step Solution
There are 3 Steps involved in it
1 Expert Approved Answer
Step: 1 Unlock

To solve these questions well need to analyze the graph and calculate the necessary values 1 Average ... View full answer
Question Has Been Solved by an Expert!
Get step-by-step solutions from verified subject matter experts
Step: 2 Unlock
Step: 3 Unlock