

Question: Graph 8.1 Data plotted in the graph appear in the table below. 1) Refer to Graph 8.1. What is the average demand for the second
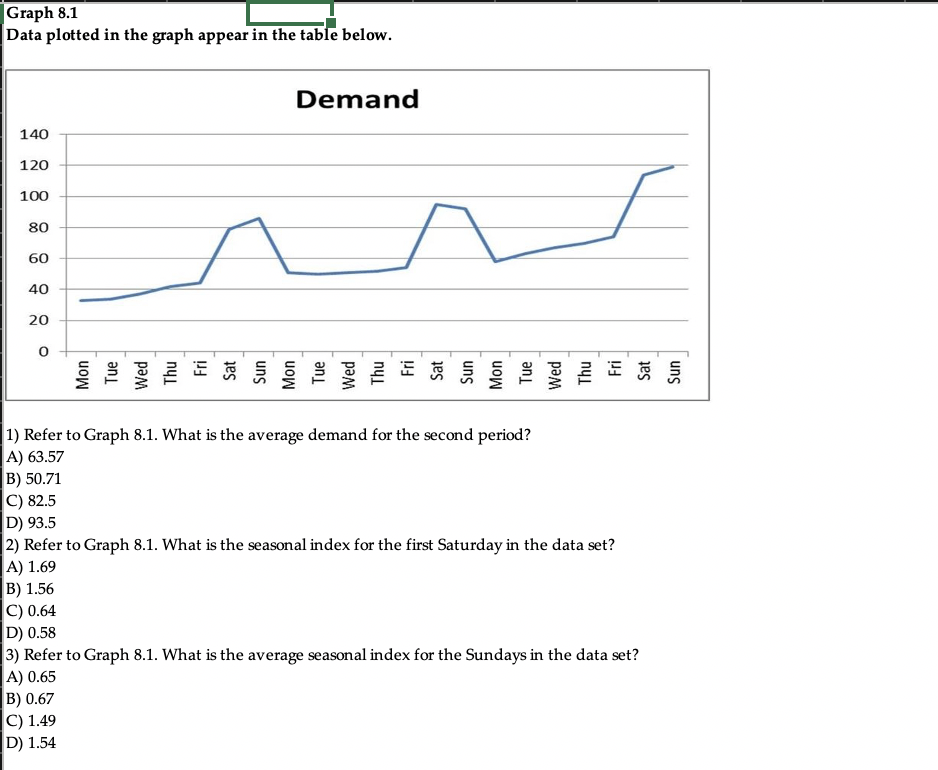
Graph 8.1 Data plotted in the graph appear in the table below. 1) Refer to Graph 8.1. What is the average demand for the second period? A) 63.57 B) 50.71 C) 82.5 D) 93.5 2) Refer to Graph 8.1. What is the seasonal index for the first Saturday in the data set? A) 1.69 B) 1.56 C) 0.64 D) 0.58 3) Refer to Graph 8.1. What is the average seasonal index for the Sundays in the data set? A) 0.65 B) 0.67 C) 1.49 D) 1.54 Graph 8.1 Data plotted in the graph appear in the table below. 1) Refer to Graph 8.1. What is the average demand for the second period? A) 63.57 B) 50.71 C) 82.5 D) 93.5 2) Refer to Graph 8.1. What is the seasonal index for the first Saturday in the data set? A) 1.69 B) 1.56 C) 0.64 D) 0.58 3) Refer to Graph 8.1. What is the average seasonal index for the Sundays in the data set? A) 0.65 B) 0.67 C) 1.49 D) 1.54
Step by Step Solution
There are 3 Steps involved in it

Get step-by-step solutions from verified subject matter experts