

Question: Data was collected for 370 randomly selected 10 minute intervals. For each ten-minute interval, the number of people entering the atrium of a large mall
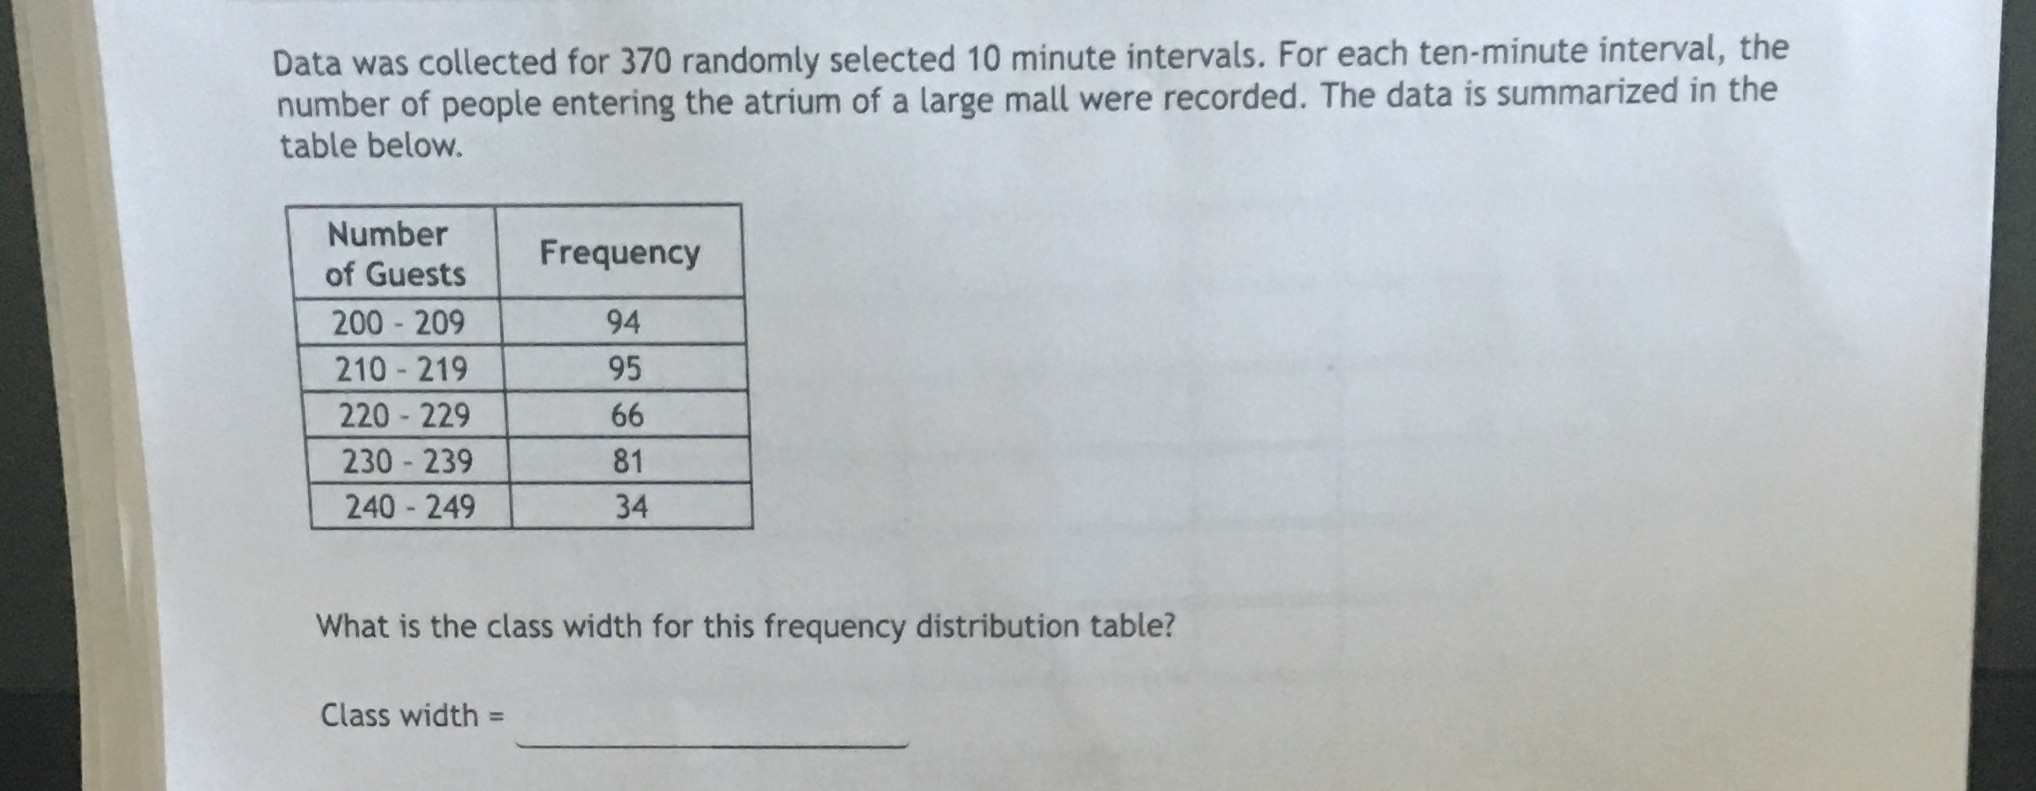
Data was collected for 370 randomly selected 10 minute intervals. For each ten-minute interval, the number of people entering the atrium of a large mall were recorded. The data is summarized in the table below. Number of Guests Frequency 200 - 209 94 210 - 219 95 220 - 229 66 230 - 239 81 240 - 249 34 What is the class width for this frequency distribution table? Class width =
Step by Step Solution
There are 3 Steps involved in it
1 Expert Approved Answer
Step: 1 Unlock

Question Has Been Solved by an Expert!
Get step-by-step solutions from verified subject matter experts
Step: 2 Unlock
Step: 3 Unlock