

Question: Dataset myeloma.csv : https://docs.google.com/spreadsheets/d/13hDIdpgjVEs98fUAiv80N3xn1JuxWd2jlleeLzcanto/edit?usp=sharing use python code to solve it Krall, Uthoff, and Harley (1975) analyzed data from a study on multiple myeloma in which
Dataset myeloma.csv : https://docs.google.com/spreadsheets/d/13hDIdpgjVEs98fUAiv80N3xn1JuxWd2jlleeLzcanto/edit?usp=sharing
use python code to solve it
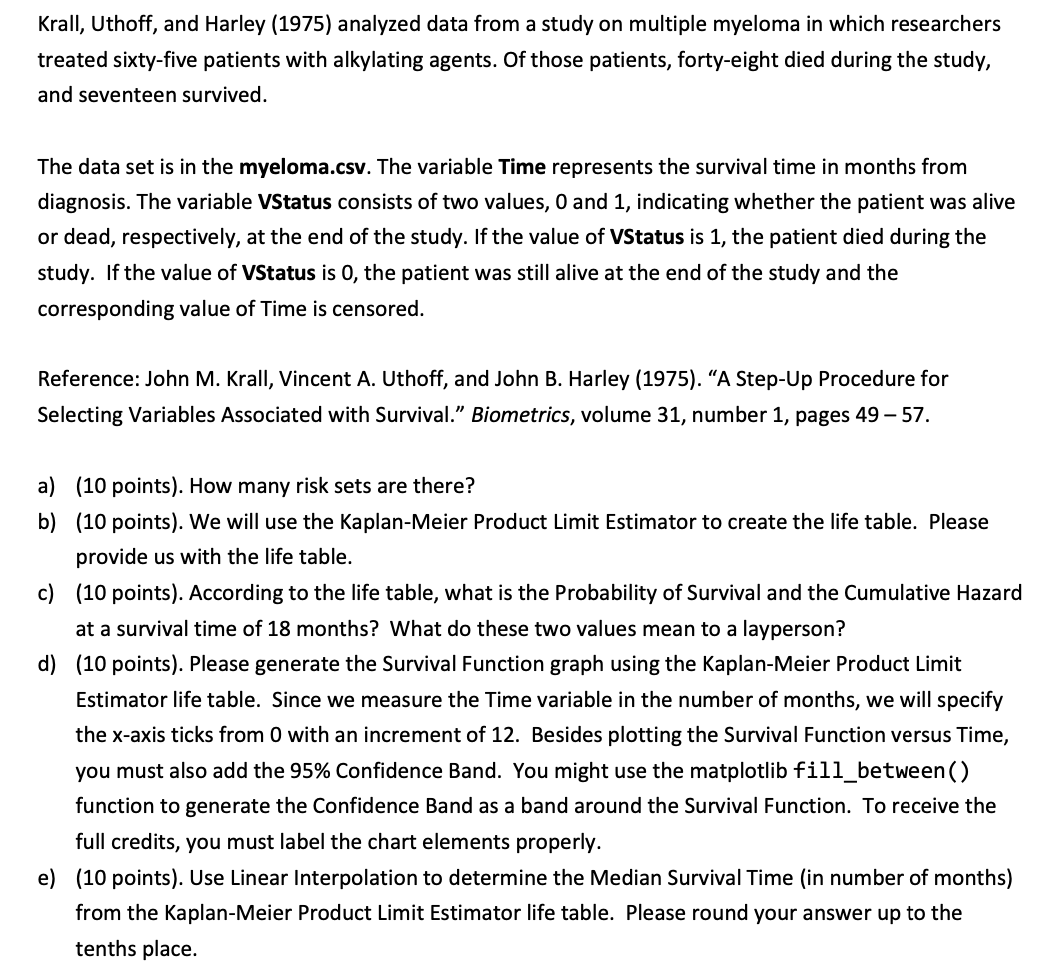
Krall, Uthoff, and Harley (1975) analyzed data from a study on multiple myeloma in which researchers treated sixty-five patients with alkylating agents. Of those patients, forty-eight died during the study, and seventeen survived. The data set is in the myeloma.csv. The variable Time represents the survival time in months from diagnosis. The variable VStatus consists of two values, 0 and 1 , indicating whether the patient was alive or dead, respectively, at the end of the study. If the value of VStatus is 1 , the patient died during the study. If the value of VStatus is 0 , the patient was still alive at the end of the study and the corresponding value of Time is censored. Reference: John M. Krall, Vincent A. Uthoff, and John B. Harley (1975). "A Step-Up Procedure for Selecting Variables Associated with Survival." Biometrics, volume 31, number 1, pages 4957. a) (10 points). How many risk sets are there? b) (10 points). We will use the Kaplan-Meier Product Limit Estimator to create the life table. Please provide us with the life table. c) (10 points). According to the life table, what is the Probability of Survival and the Cumulative Hazard at a survival time of 18 months? What do these two values mean to a layperson? d) (10 points). Please generate the Survival Function graph using the Kaplan-Meier Product Limit Estimator life table. Since we measure the Time variable in the number of months, we will specify the x-axis ticks from 0 with an increment of 12. Besides plotting the Survival Function versus Time, you must also add the 95% Confidence Band. You might use the matplotlib fill_between() function to generate the Confidence Band as a band around the Survival Function. To receive the full credits, you must label the chart elements properly. e) (10 points). Use Linear Interpolation to determine the Median Survival Time (in number of months) from the Kaplan-Meier Product Limit Estimator life table. Please round your answer up to the tenths place
Step by Step Solution
There are 3 Steps involved in it

Get step-by-step solutions from verified subject matter experts