Question: Deseasonalized Forecasts. Forecast using the following methods (use the deseasonalized data) Start each forecast in period 5 and continue through four periods into the future.
Deseasonalized Forecasts. Forecast using the following methods (use the deseasonalized data) Start each forecast in period 5 and continue through four periods into the future.
1) Moving Average 2) Weighted Moving Average 3) Exponential Smoothing (use both values of Discuss which is best in your case. 4) Trend Adjusted Forecast. 5) Least Squares (use all your data to calculate your a and b value.
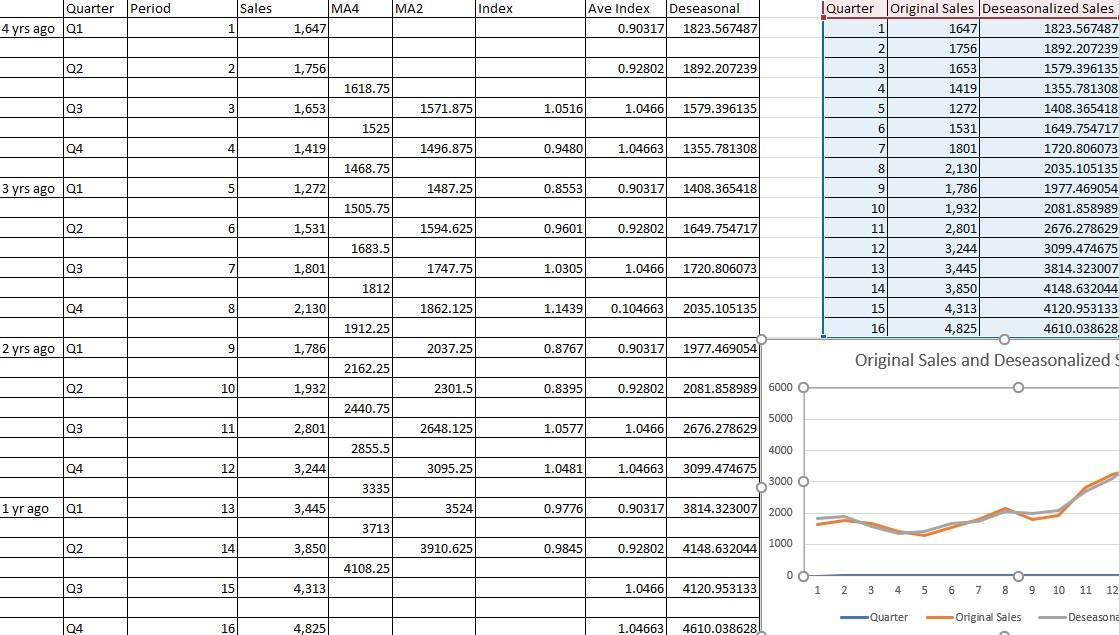
Sales MA2 Index Quarter Period 4 yrs ago 01 MA4 1,647 Ave Index Deseasonal 0.90317 1823.567487 Q2 2 1,756 0.92802 1892.207239 1618.75 Q3 3 1,653 1571.875 1.0516 1.0466 1579.396135 1525 Q4 4 1,419 1496.875 0.9480 1.04663 1355.781308 1468.75 Quarter Original Sales Deseasonalized Sales 1 1647 1823.567487 2 1756 1892.207239 3 1653 1579.396135 4 1419 1355.781308 5 1272 1408.365418 6 1531 1649.754717 7 1801 1720.806073 8 8 2,130 2035.105135 9 1,786 1977.469054 1,932 2081.858989 11 2,801 2676.278629 12 3,244 3099.474675 13 3,445 3814.323007 14 3,850 4148.632044 15 4,313 4120.953133 16 4,825 4610.038628 3 yrs ago 01 5 1,272 1487.25 0.8553 0.90317 1408.365418 1505.75 10 Q2 6 1,531 1594.625 0.9601 0.92802 1649.754717 1683.5 Q3 7 1,801 1747.75 1.0305 1.0466 1720.806073 1812 Q4 8 8 2,130 1862.125 1.1439 0.104663 2035.105135 1912.25 2 yrs ago 01 9 1,786 2037.25 0.8767 0.90317 1977.469054 Original Sales and Deseasonalized 2162.25 Q2 10 1,932 2301.5 0.8395 0.92802 2081.858989 6000 O 2440.75 5000 Q3 11 2,801 2648.125 1.0577 1.0466 2676.278629 2855.5 4000 04 12 3,244 3095.25 1.0481 1.04663 3099.474675 3000 0 3335 1 yr ago Q1 13 3,445 3524 0.9776 0.90317 3814.323007 2000 3713 Q2 14 3,850 3910.625 0.9845 0.92802 4148.632044 1000 4108.25 Q3 15 4,313 1.0466 4120.953133 1 1 2 3 4 5 6 7 8 9 10 11 12 Quarter Original Sales Deseasona Q4 16 4,825 1.04663 4610.038628 Sales MA2 Index Quarter Period 4 yrs ago 01 MA4 1,647 Ave Index Deseasonal 0.90317 1823.567487 Q2 2 1,756 0.92802 1892.207239 1618.75 Q3 3 1,653 1571.875 1.0516 1.0466 1579.396135 1525 Q4 4 1,419 1496.875 0.9480 1.04663 1355.781308 1468.75 Quarter Original Sales Deseasonalized Sales 1 1647 1823.567487 2 1756 1892.207239 3 1653 1579.396135 4 1419 1355.781308 5 1272 1408.365418 6 1531 1649.754717 7 1801 1720.806073 8 8 2,130 2035.105135 9 1,786 1977.469054 1,932 2081.858989 11 2,801 2676.278629 12 3,244 3099.474675 13 3,445 3814.323007 14 3,850 4148.632044 15 4,313 4120.953133 16 4,825 4610.038628 3 yrs ago 01 5 1,272 1487.25 0.8553 0.90317 1408.365418 1505.75 10 Q2 6 1,531 1594.625 0.9601 0.92802 1649.754717 1683.5 Q3 7 1,801 1747.75 1.0305 1.0466 1720.806073 1812 Q4 8 8 2,130 1862.125 1.1439 0.104663 2035.105135 1912.25 2 yrs ago 01 9 1,786 2037.25 0.8767 0.90317 1977.469054 Original Sales and Deseasonalized 2162.25 Q2 10 1,932 2301.5 0.8395 0.92802 2081.858989 6000 O 2440.75 5000 Q3 11 2,801 2648.125 1.0577 1.0466 2676.278629 2855.5 4000 04 12 3,244 3095.25 1.0481 1.04663 3099.474675 3000 0 3335 1 yr ago Q1 13 3,445 3524 0.9776 0.90317 3814.323007 2000 3713 Q2 14 3,850 3910.625 0.9845 0.92802 4148.632044 1000 4108.25 Q3 15 4,313 1.0466 4120.953133 1 1 2 3 4 5 6 7 8 9 10 11 12 Quarter Original Sales Deseasona Q4 16 4,825 1.04663 4610.038628


