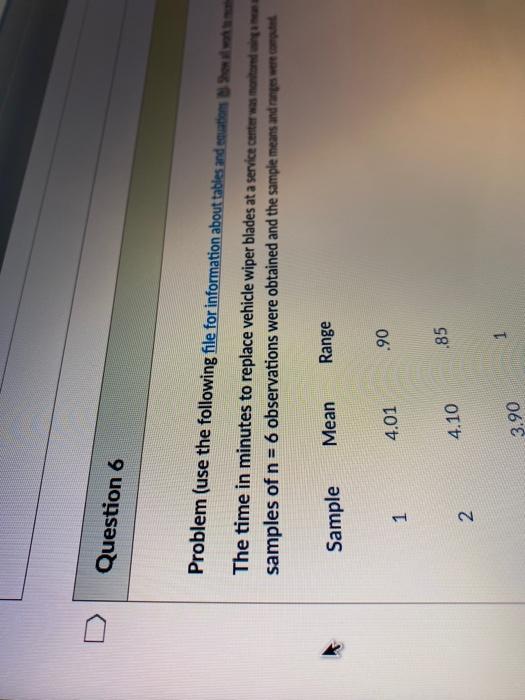
Question: determine the upper and lower limits for mean and range charts. is the process within the control limits? Sample Mean Range 1 4.01 .90 2

determine the upper and lower limits for mean and range charts. is the process within the control limits? determine the upper and lower limits for mean and
determine the upper and lower limits for mean and
Sample Mean Range 1 4.01 .90 2 4.10 .85 3 3.90 1 4 3.85 .94 4.80 .73 Question 6 Problem (use the following file for information about tables and cautions en The time in minutes to replace vehicle wiper blades at a service center was metode samples of n = 6 observations were obtained and the sample means and ranges were compte Sample Mean Range .90 4.01 1 4.10 .85 N 1 3.90

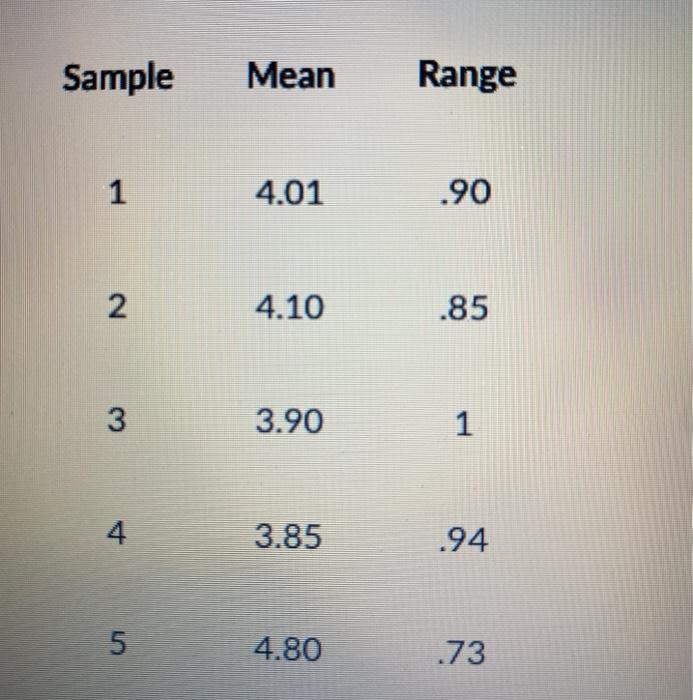
Step by Step Solution

There are 3 Steps involved in it

1 Expert Approved Answer
Step: 1 Unlock blur-text-image
Question Has Been Solved by an Expert!

Get step-by-step solutions from verified subject matter experts

Step: 2 Unlock
Step: 3 Unlock

Students Have Also Explored These Related General Management Questions!