

Question: Determine whether the table represents a discrete probability distribution. Explain why or why not. x P(x) 4 0.6 5 0.2 6 0.2 0.2 The table

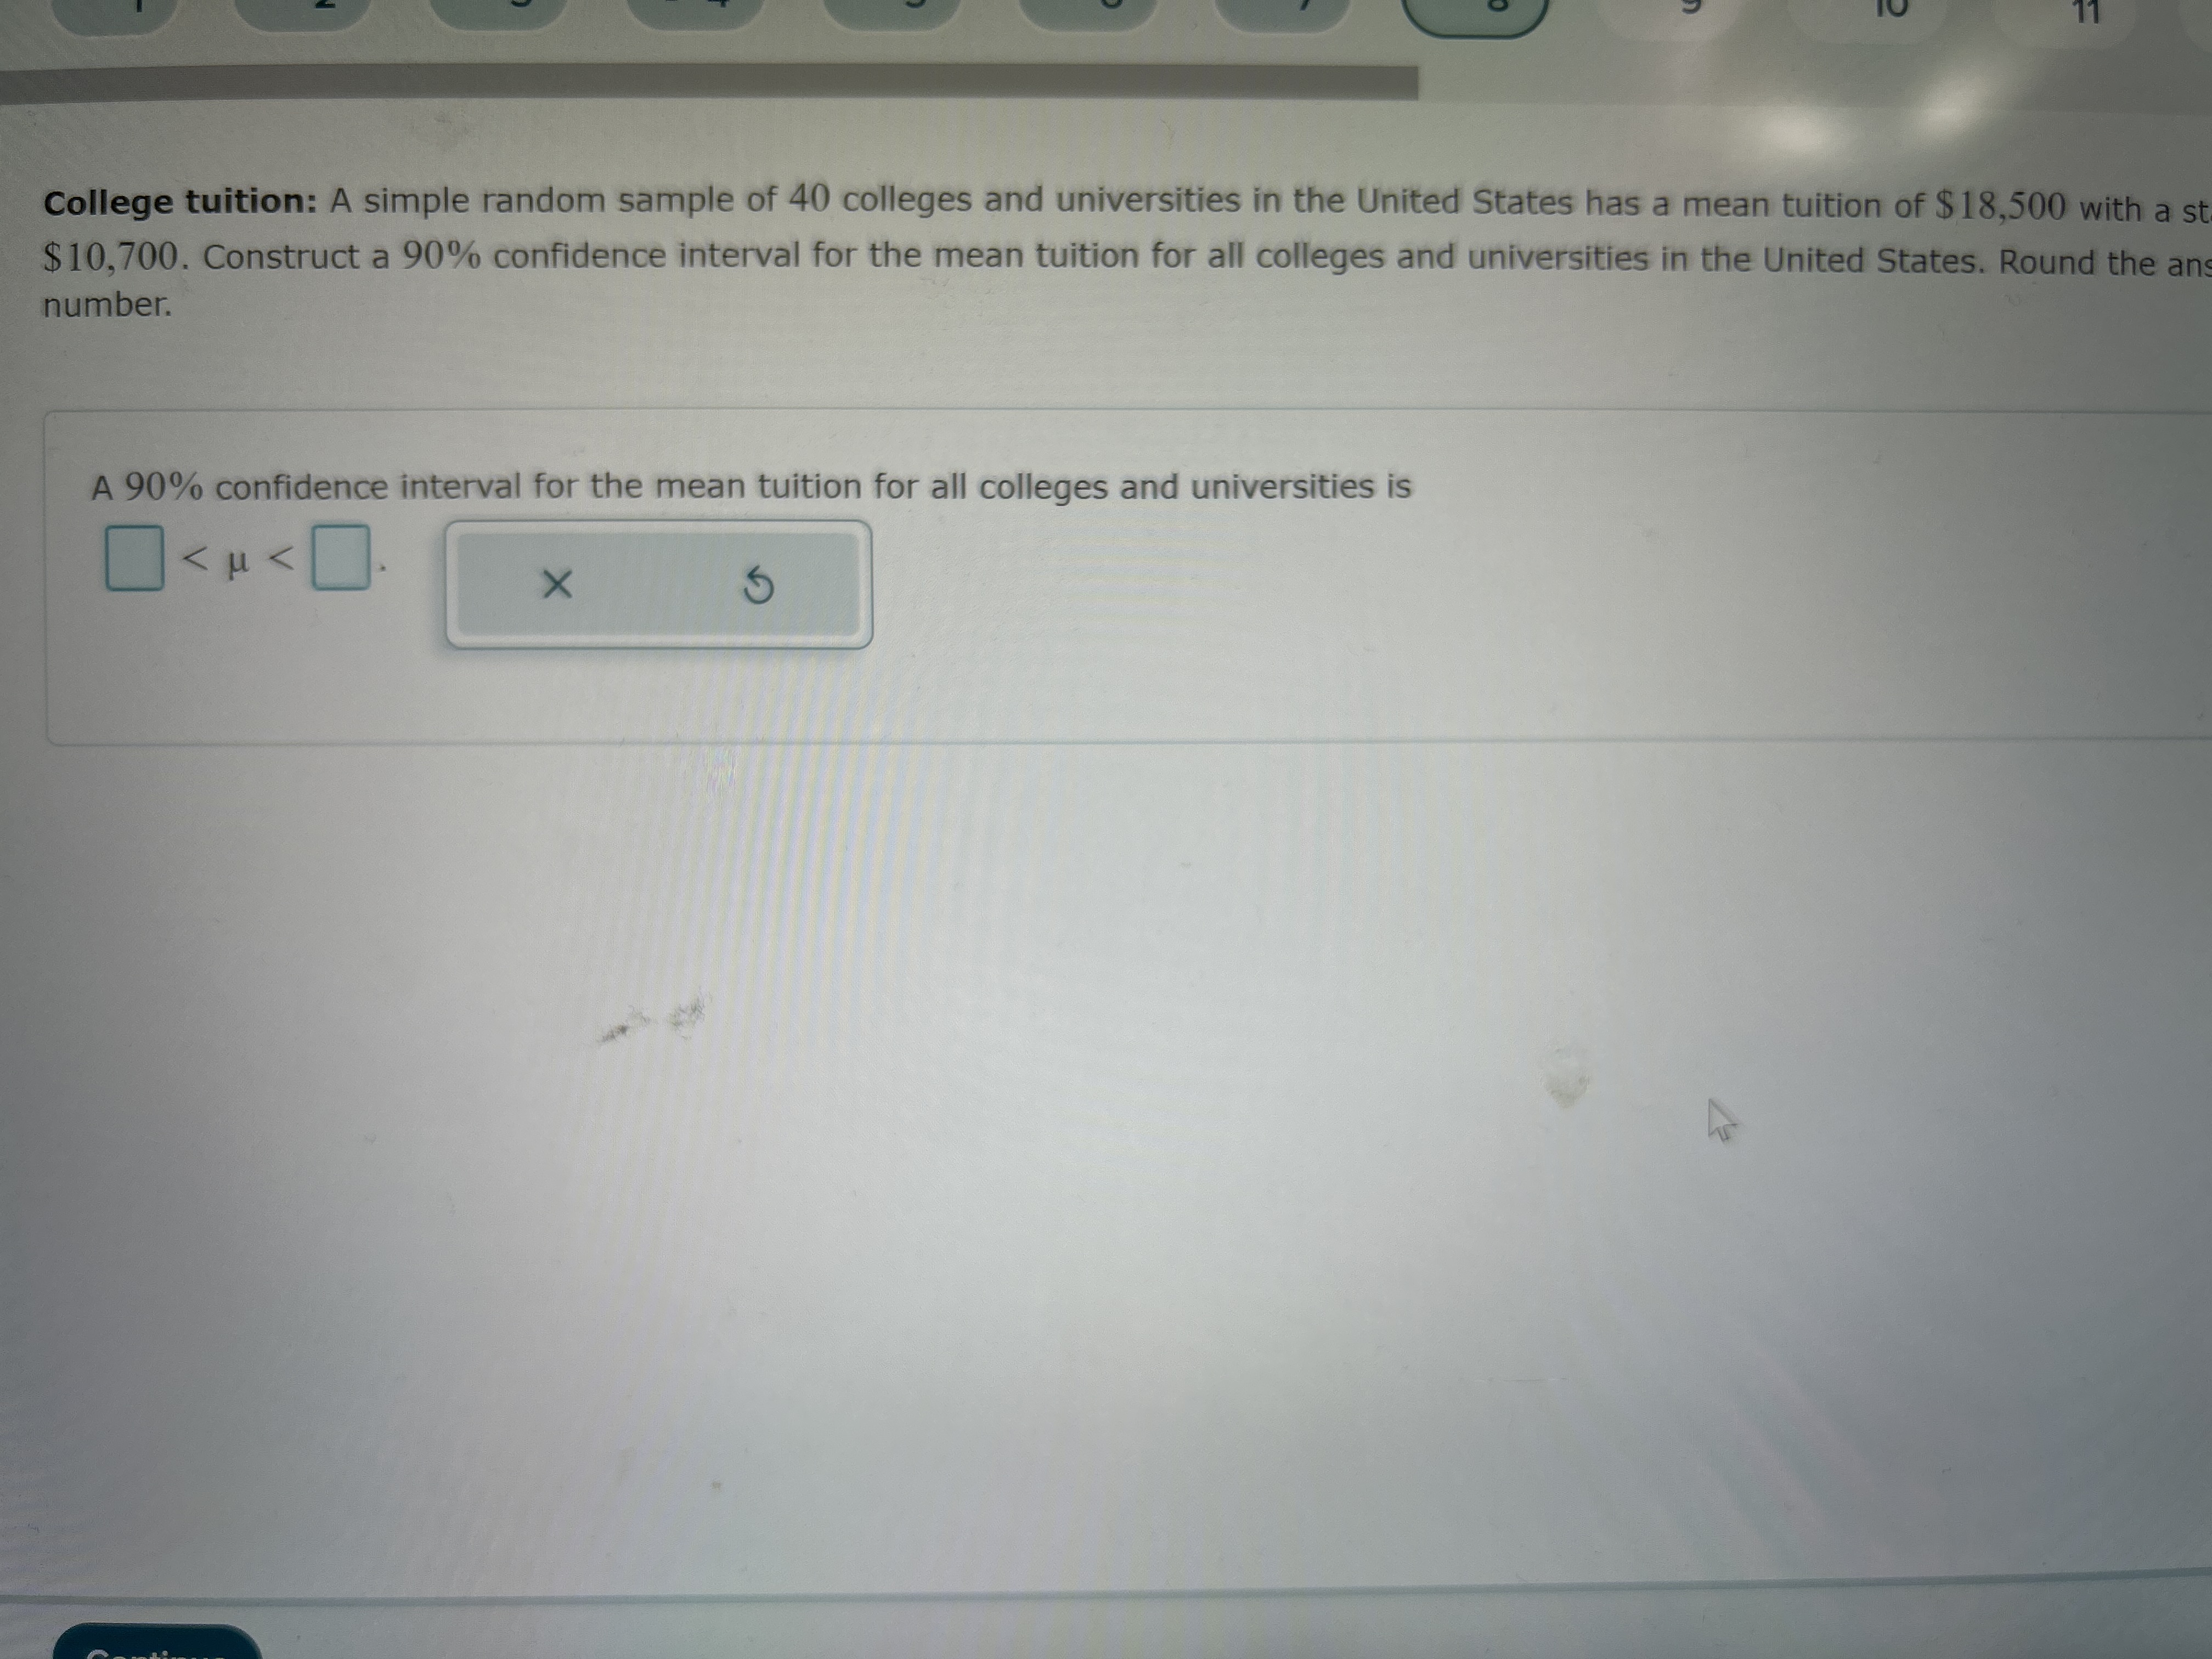


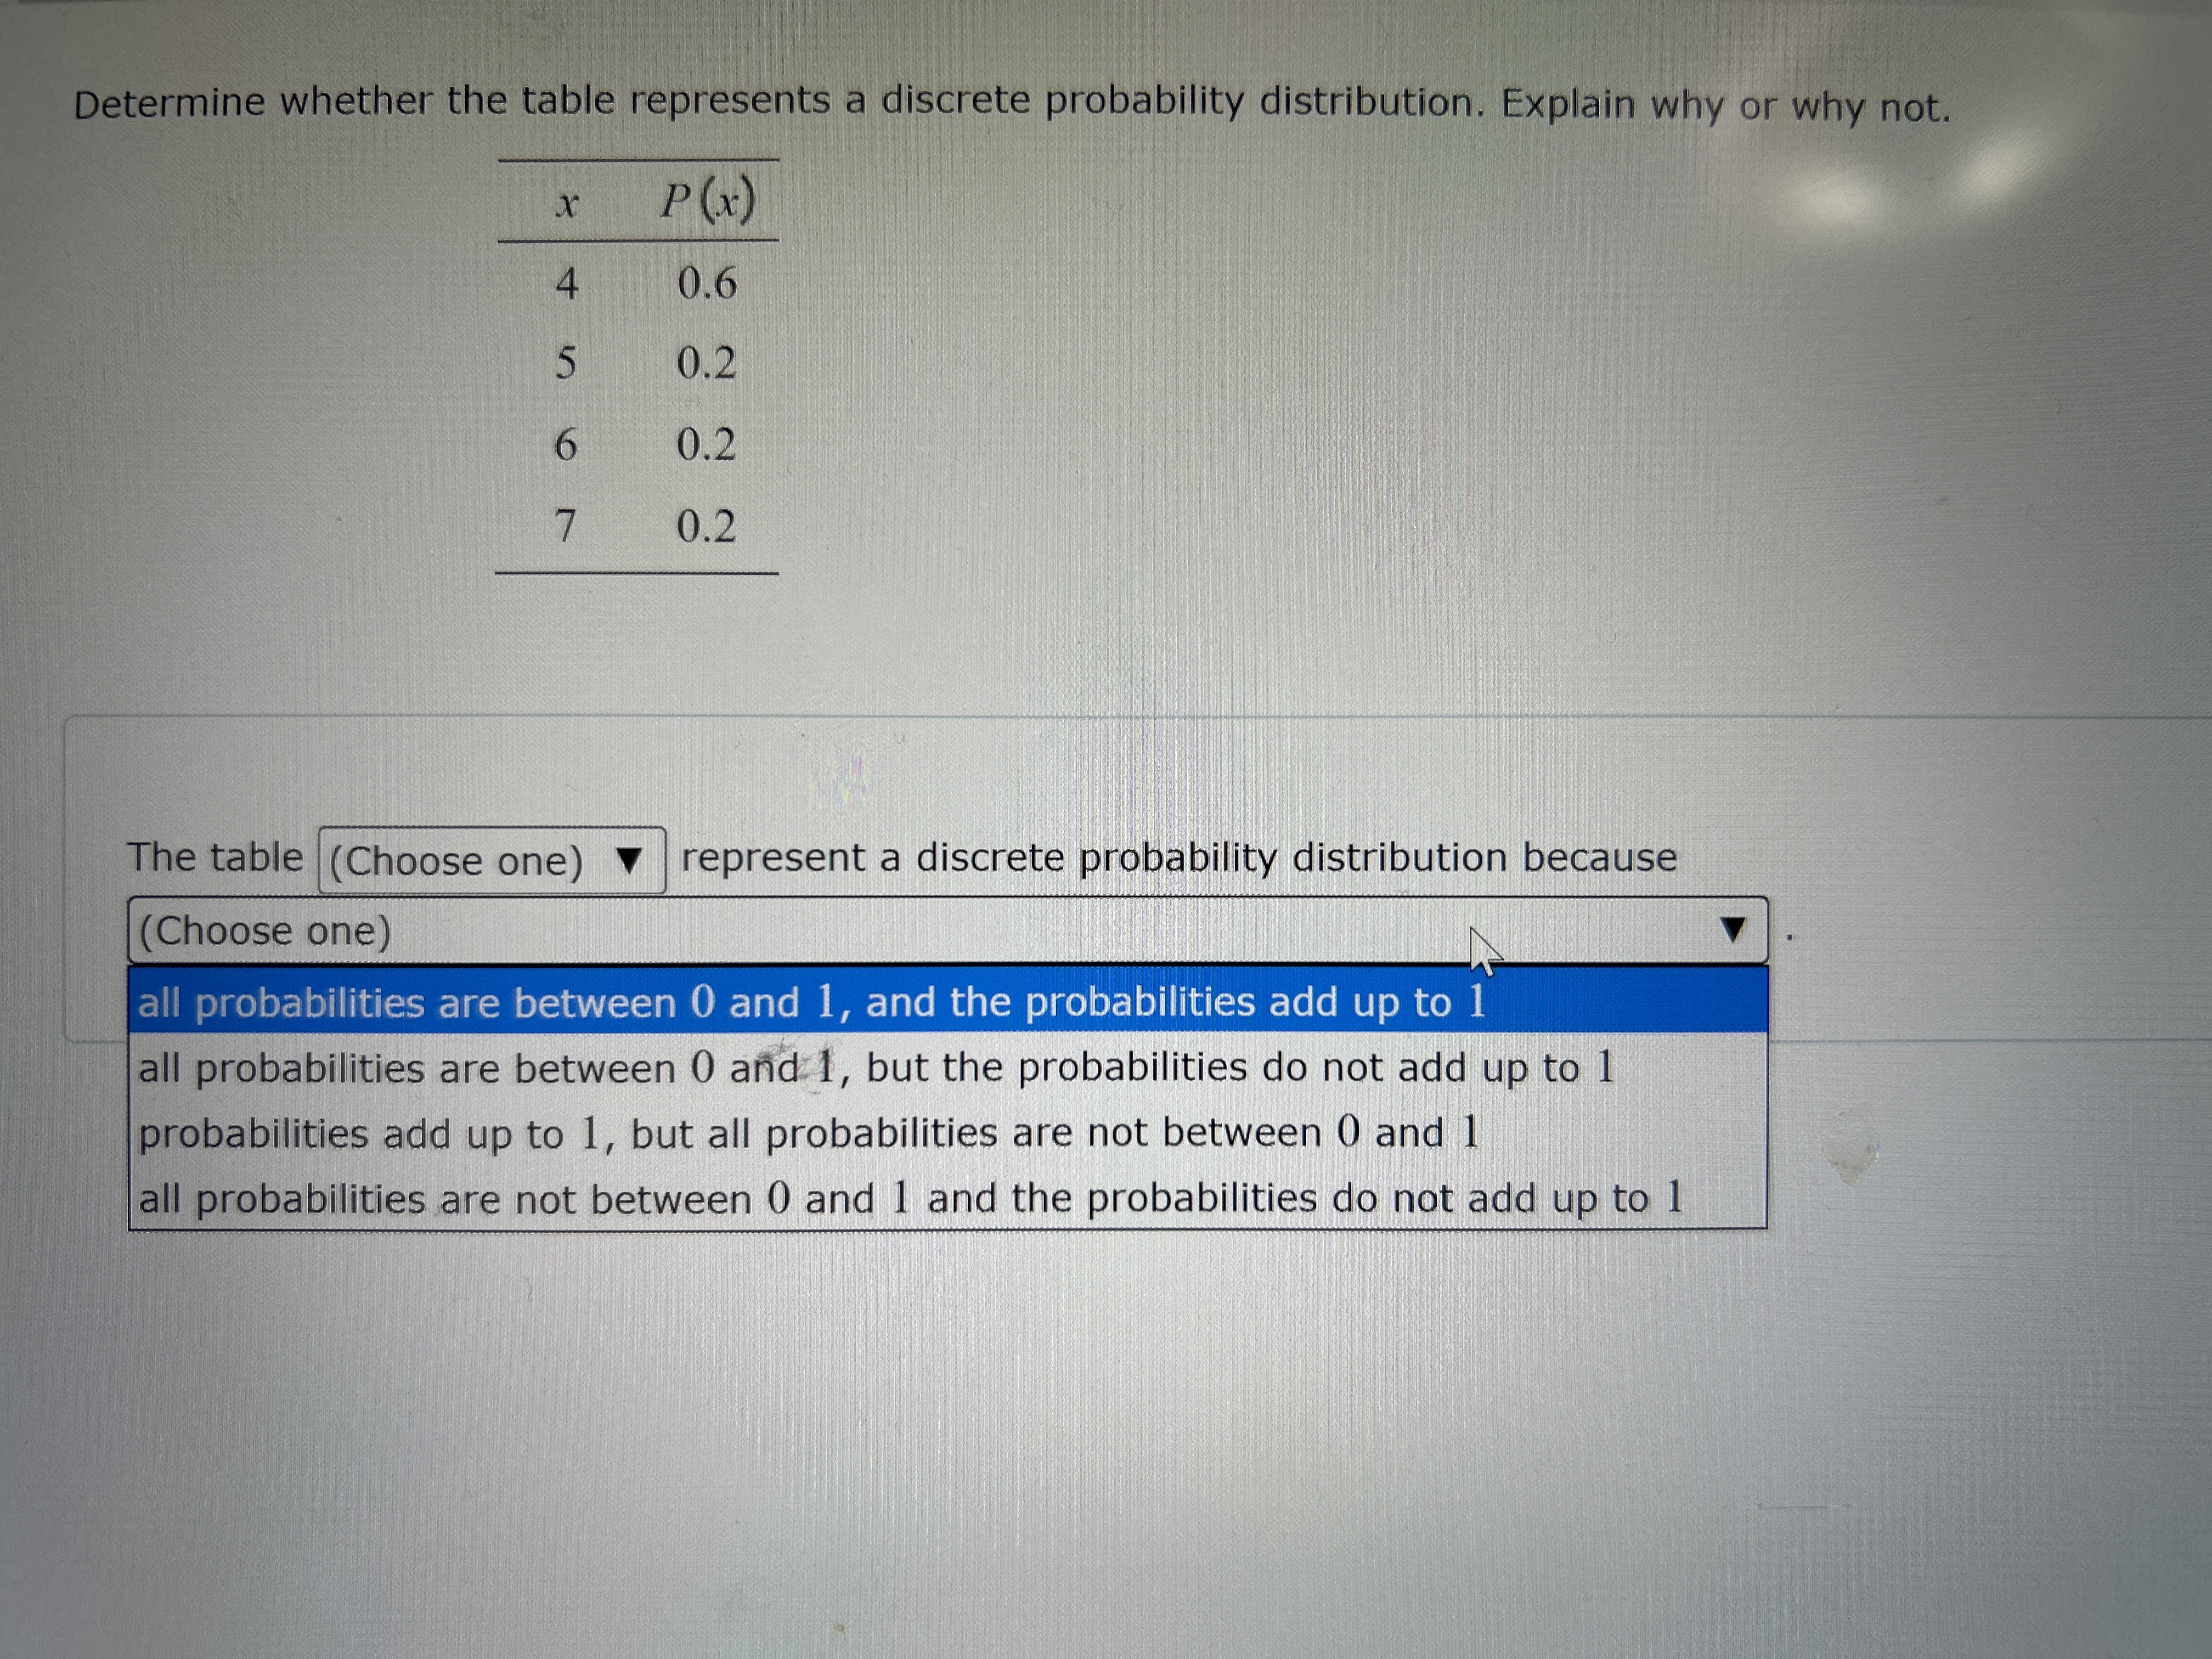

Determine whether the table represents a discrete probability distribution. Explain why or why not. x P(x) 4 0.6 5 0.2 6 0.2 0.2 The table (Choose one) V represent a discrete probability distribution because (Choose one) all probabilities are between 0 and 1, and the probabilities add up to 1 all probabilities are between 0 and 1, but the probabilities do not add up to 1 probabilities add up to 1, but all probabilities are not between 0 and 1 all probabilities are not between 0 and 1 and the probabilities do not add up to 1College tuition: A simple random sample of 40 colleges and universities in the United States has a mean tuition of $ 18,500 with a st $10,700. Construct a 90% confidence interval for the mean tuition for all colleges and universities in the United States. Round the an number. A 90% confidence interval for the mean tuition for all colleges and universities is D
Step by Step Solution
There are 3 Steps involved in it

Get step-by-step solutions from verified subject matter experts