

Question: Develop your X bar bar & R chart to show: the X bar bar R bar, the UCL and LCL for X, the UCL and
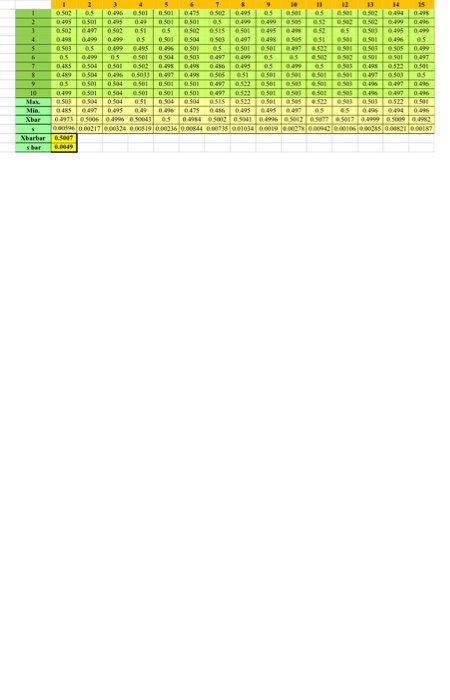
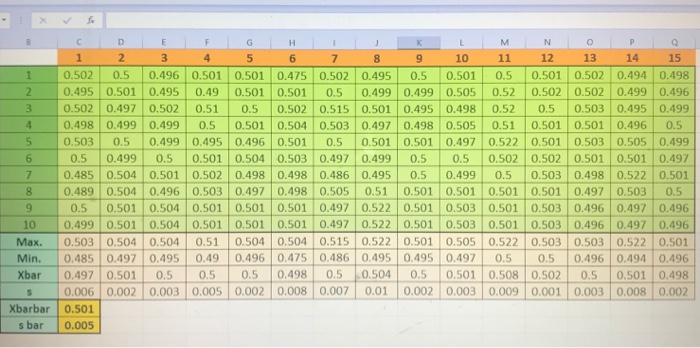
Develop your X bar bar & R chart to show: the X bar bar R bar, the UCL and LCL for X, the UCL and LCL for R Process Capability Ratio (Cp). 1 2 3 4 5 1 2 3 4 5 6 7 8 9 10 11 12 13 14 0.502 0.5 0.496 0.501 0.501 0.475 0.502 0.495 0. 5 0.501 0.5 0.501 0.502 0.494 0.498 0.495 0.501 0.495 0.49 0.501 0.501 0.5 0.499 0.499 0.505 0.52 0.502 0.502 0.499 0.496 0.502 0.497 0.502 0.51 0.5 0.502 0.515 0.501 0.495 0.498 0.52 0.5 0.503 0.495 0.499 0.498 0.499 0.499 0.5 0.501 0.504 0.503 0.497 0.498 0.505 0.51 0.501 0.501 0.496 0.5 0.503 0.5 0.499 0.495 0.496 0.501 0.5 0.501 0.501 0.497 0.522 0.501 0.503 0.505 0.499 0.5 0.499 0.5 0.501 0.504 0.503 0.497 0.499 0.5 0.5 0.502 0.502 0.501 0.501 0.497 0.485 0.504 0.501 0.502 0.498 0.498 0.486 0.495 0.5 0.499 0.5 0.503 0.498 0.522 0.501 0.489 0.504 0.496 0.503 0.497 0.498 0.505 0.51 0.501 0.501 0.501 0.501 0.497 0.503 0.5 0.5 0.501 0.504 0.501 0.501 0.501 0.497 0.522 0.501 0.503 0.501 0.503 0.496 0.497 0.496 0.499 0.501 0.504 0.501 0.501 0.501 0.497 0.522 0.501 0.503 0.501 0.503 0.496 0.497 0.496 0.503 0.504 0.504 0.51 0.504 0.504 0.515 0.522 0.501 0.505 0.522 0.503 0.503 0.522 0.501 0.485 0.497 0.495 0.49 0.496 0.475 0.486 0.495 0.495 0.497 0.5 0.5 0.496 0.494 0.496 0.497 0.501 0.5 0.5 0.5 0.498 0.5 0.504 0.5 0.501 0.508 0.502 0.5 0.501 0.498 0.006 0.002 0.003 0.005 0.002 0.008 0.007 0.01 0.002 0.003 0.009 0.001 0.003 0.008 0.002 0.501 0.005 10 . Min. Xbarbar s bar Develop your X bar bar & R chart to show: the X bar bar R bar, the UCL and LCL for X, the UCL and LCL for R Process Capability Ratio (Cp). 1 2 3 4 5 1 2 3 4 5 6 7 8 9 10 11 12 13 14 0.502 0.5 0.496 0.501 0.501 0.475 0.502 0.495 0. 5 0.501 0.5 0.501 0.502 0.494 0.498 0.495 0.501 0.495 0.49 0.501 0.501 0.5 0.499 0.499 0.505 0.52 0.502 0.502 0.499 0.496 0.502 0.497 0.502 0.51 0.5 0.502 0.515 0.501 0.495 0.498 0.52 0.5 0.503 0.495 0.499 0.498 0.499 0.499 0.5 0.501 0.504 0.503 0.497 0.498 0.505 0.51 0.501 0.501 0.496 0.5 0.503 0.5 0.499 0.495 0.496 0.501 0.5 0.501 0.501 0.497 0.522 0.501 0.503 0.505 0.499 0.5 0.499 0.5 0.501 0.504 0.503 0.497 0.499 0.5 0.5 0.502 0.502 0.501 0.501 0.497 0.485 0.504 0.501 0.502 0.498 0.498 0.486 0.495 0.5 0.499 0.5 0.503 0.498 0.522 0.501 0.489 0.504 0.496 0.503 0.497 0.498 0.505 0.51 0.501 0.501 0.501 0.501 0.497 0.503 0.5 0.5 0.501 0.504 0.501 0.501 0.501 0.497 0.522 0.501 0.503 0.501 0.503 0.496 0.497 0.496 0.499 0.501 0.504 0.501 0.501 0.501 0.497 0.522 0.501 0.503 0.501 0.503 0.496 0.497 0.496 0.503 0.504 0.504 0.51 0.504 0.504 0.515 0.522 0.501 0.505 0.522 0.503 0.503 0.522 0.501 0.485 0.497 0.495 0.49 0.496 0.475 0.486 0.495 0.495 0.497 0.5 0.5 0.496 0.494 0.496 0.497 0.501 0.5 0.5 0.5 0.498 0.5 0.504 0.5 0.501 0.508 0.502 0.5 0.501 0.498 0.006 0.002 0.003 0.005 0.002 0.008 0.007 0.01 0.002 0.003 0.009 0.001 0.003 0.008 0.002 0.501 0.005 10 . Min. Xbarbar s bar
Step by Step Solution
There are 3 Steps involved in it

Get step-by-step solutions from verified subject matter experts