Question: Developers have different approaches to selecting markets for acquisition and development. But regardless of the approach, the most successful developers have one thing in common:
Developers have different approaches to selecting markets for acquisition and development. But regardless of the approach, the most successful developers have one thing in common: they're data driven, and they're always on the lookout for the next opportunity.
One way of monitoring the top markets in the US is by subscribing to the STR Lodging Review. Using the below information, discuss which markets you think a hotel developer may want to explore further. Please use the data to illustrate why the market may be worth exploring
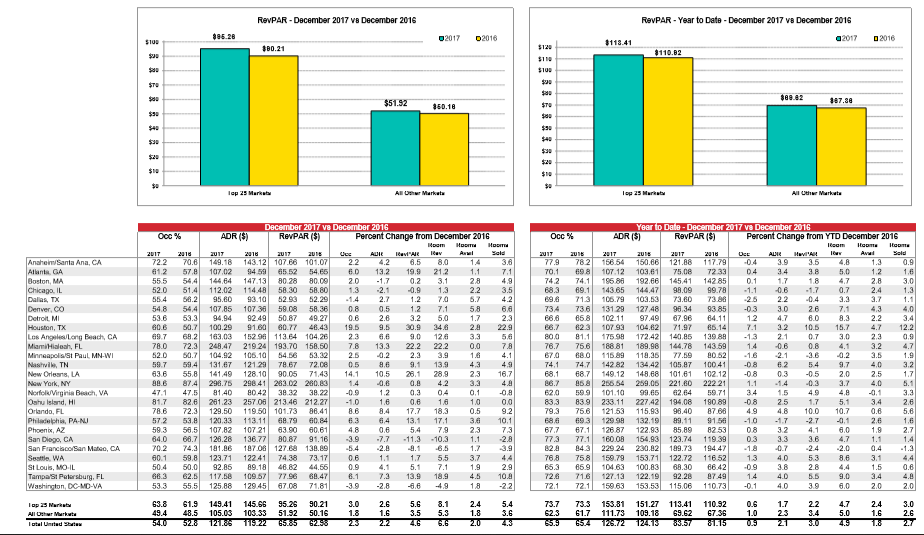
RevPAR - December 2017 ve December 2016 RevPAR - Year to Date - December 2017 ve December 2016 $100 2017 02016 2017 2016 $118.41 880.21 $110.02 $100 STO $92 $20 $69.82 $51.92 387.80 350.18 STO $30 $30 $20 $10 $. Top 25 Market All Other Market Top 25 Market All the Market Occ% Occ% les 722 2015 782 698 74.1 69.1 2010 70.6 57.8 544 514 56.2 544 53.3 50.7 68.2 72.3 50.7 Anaheim Santa Ana, CA Atlanta, GA Boston, MA Chicago, IL Dallas, TX Denver, CO Detroit, MI Houston, TX Los Angeles Long Beach, CA Miami Hialeah, FL Minneapolis St Paul, MN WI Nashville, TN New Orleans, LA New York, NY Norfolk Virginia Beach, VA Oahu Island, HI Orlando, FL Philadelphia, PA NU Phoenix, AZ San Diego, CA San Francisco San Mateo, CA Seattle, WA St Louis, MO IL Tampa St Petersburg, FL Washington, DC-MO-VA 612 555 520 55.4 548 53.6 60.6 697 78.0 52.0 59.7 636 88.6 47.1 81.7 78.6 572 59.3 64.0 702 60.1 50.4 66.3 53.3 December 2017 V8 December 2016 ADR ($) RevPAR ($) Percent Change from December 2016 HOSITT HOT 2017 2018 2017 2015 Ues AUR IAK Sold 149.18 143.12 107.66 101.07 2.2 6.5 8.0 107.02 94.59 6552 54.65 60 13.2 19.9 21.2 1.1 7.1 144.64 147.13 80.28 80.09 20 -1.7 0.2 3.1 28 4.9 112.02 114.48 58.30 58.80 -2.1 -0.9 1.3 2.2 3.5 95.60 93.10 52.90 52.29 -1.4 2.7 1.2 5.7 107.85 10736 59.08 58.38 0.8 0.5 1.2 7.1 58 6.6 94.94 92.49 50.87 49.27 0.6 2.6 3.2 5.0 1.7 2.3 100.29 91.60 60.77 46.43 19.5 9.5 30.9 34.6 2.3 22.9 163.03 152 96 113.64 104.25 23 6.6 9.0 12.6 3.3 5.6 248.47 21924 193.70 158.50 7.8 13.3 222 222 0.0 7.8 104.92 106.10 54.56 53.32 2.5 -0.2 2.3 3.9 131.67 121.29 78.67 72.08 0.5 8.6 13.9 4.9 141.49 128.10 90.05 71.43 14.1 10.5 28.1 28.9 2.3 296.75 298.41 263.02 260.83 1.4 0.8 0.8 3.3 4. 81.40 80.42 38.32 38.22 -0.9 1.2 93 04 0.1 -0.8 261.23 25708 213.46 212.27 -1.0 1.6 0.6 16 10 0.0 129.50 119.50 101.73 86.41 8.6 8.4 17.7 18.3 0.5 9.2 120.33 113.11 68.79 60.84 13.1 17.1 3.6 10.1 107.82 107 21 63.90 60.61 4.8 0.6 5.4 79 2.3 73 128.28 136.77 80.87 91.16 -3.9 -7.7 - 11.3 -10.3 1.1 -2.8 181.86 187.08 127.89 138.89 1.7 123.71 122.41 74.38 73.17 06 1.1 1.7 5.5 3.7 92.85 89.18 46.82 44.56 0.9 5.1 1.9 2.9 117.58 109.57 77.96 68.47 6.1 13.9 189 125.88 129.45 67.08 71.81 -3.9 -2.8 -4.9 18 -2.2 2017 778 70.1 74.2 68.3 89.6 734 66.6 06.7 80.0 76.7 67.a 74.1 68.1 86.7 62.0 83.3 79.3 68.6 677 77.3 713 736 658 823 81.1 75.6 68.0 74.7 68.7 85.8 599 839 75.6 Year to Date - December 2017 ve December 2016 ADR ($) RevPAR (5) Percent Change from YTD December 2016 Ilom Hoon Ho 2016 2017 2018 ALL Huvil Avel Sold 156.54 150.66 121.88 117.79 -0.4 3.9 1.3 0.9 107.12 103.61 75.08 7233 04 38 5.0 1.2 196.88 192.66 145.41 142.85 0.1 1.7 1.8 4.7 2.8 3.0 143.65 144.47 98.09 99.78 -1.1 -0.6 -1.7 0.7 2.4 1.3 106.79 103.53 73.60 73.86 -2.5 22 -0.4 3.3 3.7 1.1 13129 127.48 98.34 93 85 -0.3 3.0 2.6 7.1 4.0 102.11 97.49 67.96 14.11 12 4.7 6.0 8.3 2.2 3.4 107 93 104.62 71.97 66.14 7.1 10.5 15.7 12.2 175 98 172.42 140.85 139 88 -13 2.1 0.7 3.0 2.3 0.9 188.81 189.98 144.78 143.59 1.4 -0.6 0.8 3.2 4.7 115.89 112.35 77.59 80.52 -16 -2.1 -3.6 -0.2 3.5 142 82 134,42 105.87 100.41 62 54 9.7 3.2 149.12 148.68 101.61 102.12 -08 0.3 -0.5 2.0 2.5 256.54 259.05 221.60 222 21 1.1 3.7 4.0 5.1 101.10 99.65 62.64 59.71 15 -0.1 3.3 233.11 227.42 194,08 190 89 -0.8 2.5 1.7 5.1 3.4 2.6 121.53 115.93 96.40 87.66 4.9 4.8 10.0 10.7 0.8 5.6 129 99 132.19 29.11 9156 -10 -1.7 -2.7 -0.1 2.6 1.6 126 87 122.93 85.89 8253 08 3.2 4.1 0.0 1.9 2.7 160.08 154.93 123.74 119.39 0.3 3.6 4.7 1.1 1.4 229.24 230.82 189.73 194.47 -1.8 -2.0 0.4 159.79 153.71 122.72 116.52 13 53 8.6 3.1 104.63 100.83 68.30 66.42 -0.9 3.8 2.8 1.5 0.8 127.13 122.19 92.28 1.4 5.5 159 63 153.53 115.06 110.73 -0.1 4.0 39 0.0 2.0 2.0 18.7 55.8 87.4 47.5 82.6 72.3 53.8 58.5 66.7 743 59.8 50.0 62.5 55.5 67.1 77.1 100 76.8 65.3 72.6 72.1 758 65.9 71.6 72.1 Top 25 Marko All Other Market Total United States 63.8 49.4 54.0 61.9 48.5 52.0 149.41 105.03 121.05 145.66 103.33 FS232 95.26 51.92 65.85 90.21 50.16 62.50 3.0 1.8 2.6 1.6 2.2 5.6 3.5 8.1 5.3 6.6 2.4 1.8 2.0 5.4 3.6 73.7 62.3 63.9 73.3 61.7 6514 153.81 111.73 128.72 151.27 109.18 1124515 113.41 69.62 83.57 110.92 67.36 81.15 0.6 1.0 09 1.7 23 21 2.2 3.4 30 4.7 5.0 4.9 2.4 1.6 3.0 2.6 RevPAR - December 2017 ve December 2016 RevPAR - Year to Date - December 2017 ve December 2016 $100 2017 02016 2017 2016 $118.41 880.21 $110.02 $100 STO $92 $20 $69.82 $51.92 387.80 350.18 STO $30 $30 $20 $10 $. Top 25 Market All Other Market Top 25 Market All the Market Occ% Occ% les 722 2015 782 698 74.1 69.1 2010 70.6 57.8 544 514 56.2 544 53.3 50.7 68.2 72.3 50.7 Anaheim Santa Ana, CA Atlanta, GA Boston, MA Chicago, IL Dallas, TX Denver, CO Detroit, MI Houston, TX Los Angeles Long Beach, CA Miami Hialeah, FL Minneapolis St Paul, MN WI Nashville, TN New Orleans, LA New York, NY Norfolk Virginia Beach, VA Oahu Island, HI Orlando, FL Philadelphia, PA NU Phoenix, AZ San Diego, CA San Francisco San Mateo, CA Seattle, WA St Louis, MO IL Tampa St Petersburg, FL Washington, DC-MO-VA 612 555 520 55.4 548 53.6 60.6 697 78.0 52.0 59.7 636 88.6 47.1 81.7 78.6 572 59.3 64.0 702 60.1 50.4 66.3 53.3 December 2017 V8 December 2016 ADR ($) RevPAR ($) Percent Change from December 2016 HOSITT HOT 2017 2018 2017 2015 Ues AUR IAK Sold 149.18 143.12 107.66 101.07 2.2 6.5 8.0 107.02 94.59 6552 54.65 60 13.2 19.9 21.2 1.1 7.1 144.64 147.13 80.28 80.09 20 -1.7 0.2 3.1 28 4.9 112.02 114.48 58.30 58.80 -2.1 -0.9 1.3 2.2 3.5 95.60 93.10 52.90 52.29 -1.4 2.7 1.2 5.7 107.85 10736 59.08 58.38 0.8 0.5 1.2 7.1 58 6.6 94.94 92.49 50.87 49.27 0.6 2.6 3.2 5.0 1.7 2.3 100.29 91.60 60.77 46.43 19.5 9.5 30.9 34.6 2.3 22.9 163.03 152 96 113.64 104.25 23 6.6 9.0 12.6 3.3 5.6 248.47 21924 193.70 158.50 7.8 13.3 222 222 0.0 7.8 104.92 106.10 54.56 53.32 2.5 -0.2 2.3 3.9 131.67 121.29 78.67 72.08 0.5 8.6 13.9 4.9 141.49 128.10 90.05 71.43 14.1 10.5 28.1 28.9 2.3 296.75 298.41 263.02 260.83 1.4 0.8 0.8 3.3 4. 81.40 80.42 38.32 38.22 -0.9 1.2 93 04 0.1 -0.8 261.23 25708 213.46 212.27 -1.0 1.6 0.6 16 10 0.0 129.50 119.50 101.73 86.41 8.6 8.4 17.7 18.3 0.5 9.2 120.33 113.11 68.79 60.84 13.1 17.1 3.6 10.1 107.82 107 21 63.90 60.61 4.8 0.6 5.4 79 2.3 73 128.28 136.77 80.87 91.16 -3.9 -7.7 - 11.3 -10.3 1.1 -2.8 181.86 187.08 127.89 138.89 1.7 123.71 122.41 74.38 73.17 06 1.1 1.7 5.5 3.7 92.85 89.18 46.82 44.56 0.9 5.1 1.9 2.9 117.58 109.57 77.96 68.47 6.1 13.9 189 125.88 129.45 67.08 71.81 -3.9 -2.8 -4.9 18 -2.2 2017 778 70.1 74.2 68.3 89.6 734 66.6 06.7 80.0 76.7 67.a 74.1 68.1 86.7 62.0 83.3 79.3 68.6 677 77.3 713 736 658 823 81.1 75.6 68.0 74.7 68.7 85.8 599 839 75.6 Year to Date - December 2017 ve December 2016 ADR ($) RevPAR (5) Percent Change from YTD December 2016 Ilom Hoon Ho 2016 2017 2018 ALL Huvil Avel Sold 156.54 150.66 121.88 117.79 -0.4 3.9 1.3 0.9 107.12 103.61 75.08 7233 04 38 5.0 1.2 196.88 192.66 145.41 142.85 0.1 1.7 1.8 4.7 2.8 3.0 143.65 144.47 98.09 99.78 -1.1 -0.6 -1.7 0.7 2.4 1.3 106.79 103.53 73.60 73.86 -2.5 22 -0.4 3.3 3.7 1.1 13129 127.48 98.34 93 85 -0.3 3.0 2.6 7.1 4.0 102.11 97.49 67.96 14.11 12 4.7 6.0 8.3 2.2 3.4 107 93 104.62 71.97 66.14 7.1 10.5 15.7 12.2 175 98 172.42 140.85 139 88 -13 2.1 0.7 3.0 2.3 0.9 188.81 189.98 144.78 143.59 1.4 -0.6 0.8 3.2 4.7 115.89 112.35 77.59 80.52 -16 -2.1 -3.6 -0.2 3.5 142 82 134,42 105.87 100.41 62 54 9.7 3.2 149.12 148.68 101.61 102.12 -08 0.3 -0.5 2.0 2.5 256.54 259.05 221.60 222 21 1.1 3.7 4.0 5.1 101.10 99.65 62.64 59.71 15 -0.1 3.3 233.11 227.42 194,08 190 89 -0.8 2.5 1.7 5.1 3.4 2.6 121.53 115.93 96.40 87.66 4.9 4.8 10.0 10.7 0.8 5.6 129 99 132.19 29.11 9156 -10 -1.7 -2.7 -0.1 2.6 1.6 126 87 122.93 85.89 8253 08 3.2 4.1 0.0 1.9 2.7 160.08 154.93 123.74 119.39 0.3 3.6 4.7 1.1 1.4 229.24 230.82 189.73 194.47 -1.8 -2.0 0.4 159.79 153.71 122.72 116.52 13 53 8.6 3.1 104.63 100.83 68.30 66.42 -0.9 3.8 2.8 1.5 0.8 127.13 122.19 92.28 1.4 5.5 159 63 153.53 115.06 110.73 -0.1 4.0 39 0.0 2.0 2.0 18.7 55.8 87.4 47.5 82.6 72.3 53.8 58.5 66.7 743 59.8 50.0 62.5 55.5 67.1 77.1 100 76.8 65.3 72.6 72.1 758 65.9 71.6 72.1 Top 25 Marko All Other Market Total United States 63.8 49.4 54.0 61.9 48.5 52.0 149.41 105.03 121.05 145.66 103.33 FS232 95.26 51.92 65.85 90.21 50.16 62.50 3.0 1.8 2.6 1.6 2.2 5.6 3.5 8.1 5.3 6.6 2.4 1.8 2.0 5.4 3.6 73.7 62.3 63.9 73.3 61.7 6514 153.81 111.73 128.72 151.27 109.18 1124515 113.41 69.62 83.57 110.92 67.36 81.15 0.6 1.0 09 1.7 23 21 2.2 3.4 30 4.7 5.0 4.9 2.4 1.6 3.0 2.6


