

Question: do fast c) Selected comparative statement data for Best Products Company are presented in table-2. All balance sheet data are as of December 31. Net
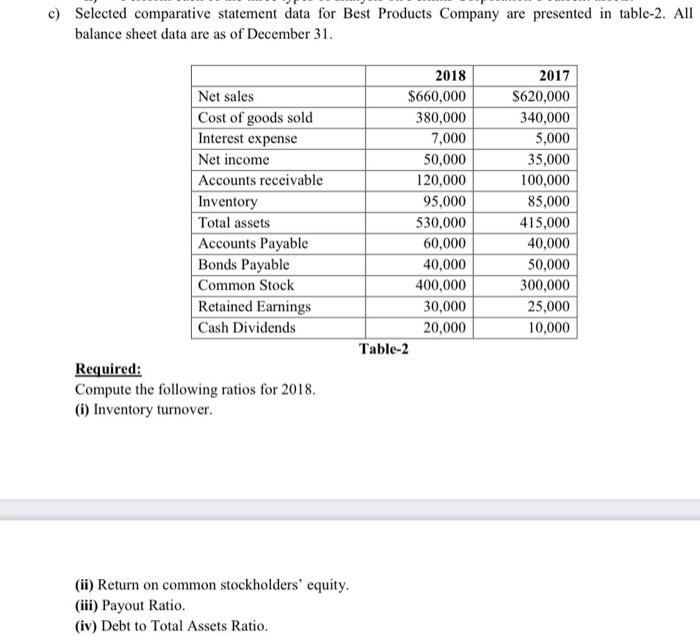
c) Selected comparative statement data for Best Products Company are presented in table-2. All balance sheet data are as of December 31. Net sales Cost of goods sold Interest expense Net income Accounts receivable Inventory Total assets Accounts Payable Bonds Payable Common Stock Retained Earnings Cash Dividends 2018 $660,000 380,000 7,000 50,000 120,000 95,000 530,000 60,000 40,000 400,000 30,000 20,000 Table-2 2017 S620,000 340,000 5,000 35,000 100,000 85,000 415,000 40,000 50,000 300,000 25,000 10,000 Required: Compute the following ratios for 2018. (i) Inventory turnover. (ii) Return on common stockholders' equity. (iii) Payout Ratio. (iv) Debt to Total Assets Ratio
Step by Step Solution
There are 3 Steps involved in it

Get step-by-step solutions from verified subject matter experts