Question: dont draw gantt chart and pls in computer 2. A project activities and related information are given in the following table. Time Estimates (Wecks) Mean

dont draw gantt chart and pls in computer dont draw gantt chart and pls in computer 2. A
2. A project activities and related information are given in the following table. Time Estimates (Wecks) Mean Activity Predecessor Optimistic Most Pessimistic (expected Variance time (a) likely time (m) time (b) time) A 3 6 B 2 5 8 2 4 6 D c 2 4 6 E A 2 3 4 F D 1 4 7 G E 2 4 6 H CD 4 5 1 F.H 2 2 2 J EH 4 5 a) Calculate the mean and variance for each activity b) Draw a Gantt chart. c) Draw the Activity-on-Node network d) Find the critical path for the project. e) Find the earliest start and finish for each activity Find the latest start and finish for each activity. B) Find the slack time for each activity

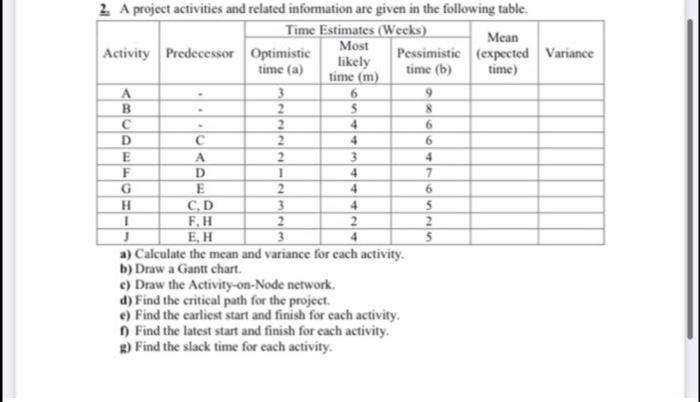
Step by Step Solution

There are 3 Steps involved in it

1 Expert Approved Answer
Step: 1 Unlock blur-text-image
Question Has Been Solved by an Expert!

Get step-by-step solutions from verified subject matter experts

Step: 2 Unlock
Step: 3 Unlock

Students Have Also Explored These Related General Management Questions!