

Question: Draft a McKinsey Matrix The following data (Table) below is taken from a firm with several business units. Using the line of business information and
Draft a McKinsey Matrix
The following data (Table) below is taken from a firm with several business units. Using the line of business information and the weightings provided, rate both the competitive position and attractiveness of each business unit. Once you've obtained a score for each, map it onto a 9-cell McKinsey matrix. For clarification, the analyzing the portfolio section will need to be completed separately for each of the 5 business units. The resulting scores will give you graph points to place on a single McKinsey Matrix. What are your recommendations for each business unit? Should they be targeted for growth or divested? Justify your answer
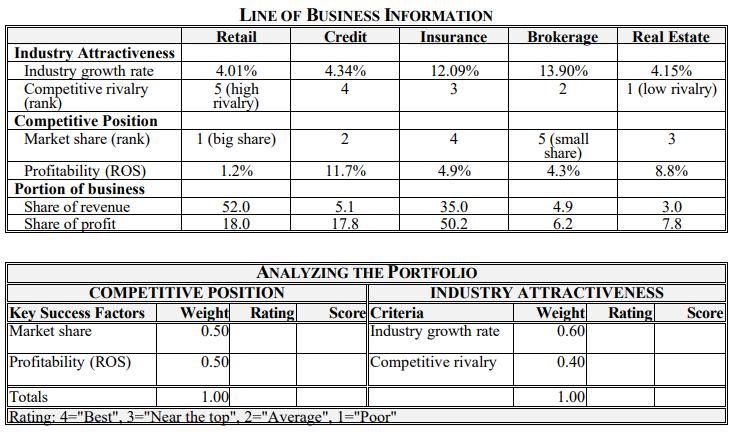
LINE OF BUSINESS INFORMATION Retail Credit Insurance Brokerage Real Estate Industry Attractiveness Industry growth rate 4.01% 4.34% 12.09% 13.90% 4.15% Competitive rivalry 5 (high 4 3 2 1 (low rivalry) (rank) rivalry) Competitive Position Market share (rank) 1 (big share) 2 4 5 (small WJ share) Profitability (ROS) 1.2% 11.7% 4.9% 4.3% 8.8% Portion of business Share of revenue 52.0 5.1 35.0 4.9 3.0 Share of profit 18.0 17.8 50.2 6.2 7.8 ANALYZING THE PORTFOLIO COMPETITIVE POSITION INDUSTRY ATTRACTIVENESS Key Success Factors Weight Rating Score Criteria Weight Rating Score Market share 0.50 Industry growth rate 0.60 Profitability (ROS) 0.50 Competitive rivalry 0.40 Totals 1.00 1.00 Rating: 4 "Best". 3-"Near the top". 2 "Average", 1="Poor"
Step by Step Solution
There are 3 Steps involved in it

Get step-by-step solutions from verified subject matter experts