

Question: Draw a complete flowchart for a program that can display midterm results of three students. i) ii) Calculate the percentage marks obtained, and Print
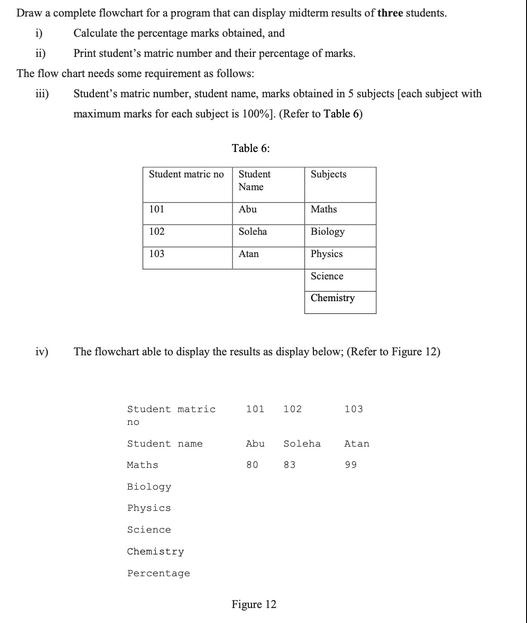
Draw a complete flowchart for a program that can display midterm results of three students. i) ii) Calculate the percentage marks obtained, and Print student's matric number and their percentage of marks. The flow chart needs some requirement as follows: iii) Student's matric number, student name, marks obtained in 5 subjects [each subject with maximum marks for each subject is 100% ] . (Refer to Table 6) iv) Table 6: Student matric no Student Subjects Name 101 Abu Maths 102 Soleha Biology 103 Atan Physics Science Chemistry The flowchart able to display the results as display below; (Refer to Figure 12) Student matric 101 102 103 no Student name Abu Soleha Atan Maths 80 83 99 Biology Physics Science Chemistry Percentage Figure 12
Step by Step Solution
3.29 Rating (149 Votes )
There are 3 Steps involved in it
The blocks used in the flow chart are standard startstop decision process ... View full answer

Get step-by-step solutions from verified subject matter experts