

Question: Here is a scatterplot for the weekly sales of a brand of frozen pizza (in kilograms) for every fourth week vs. the unit price of
Here is a scatterplot for the weekly sales of a brand of frozen pizza (in kilograms) for every fourth week vs. the unit price of the pizza for a sample of stores:
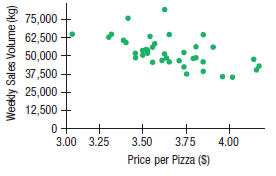
a) Check the assumptions and conditions for correlation.
b) Compute the correlation between sales and price.
c) Does this graph support the theory that as prices drop, demand for the product will increase?
d) If we assume that the number of kilograms of pizza per box is consistent and we measure sales in the number of pizza boxes sold instead of kilograms, will the correlation change? Explain.
75,000 62,500 50,000 - 37,500 - 25,000 - 12,500 + 0+ 3.00 3.25 3.50 3.75 4.00 Price per Pizza (S) Weekly Sales Volume (kg)
Step by Step Solution
3.34 Rating (169 Votes )
There are 3 Steps involved in it
a There are two quantitative variables and the sc... View full answer

Get step-by-step solutions from verified subject matter experts