

Question: Draw a plot for the relationship between risk and return, as shown below. CALCULATING PORTFOLIO RETURNS Stock A 6.00% 1.71% 13.08% Stock B 12.00% 2.67%
Draw a plot for the relationship between risk and return, as shown below.
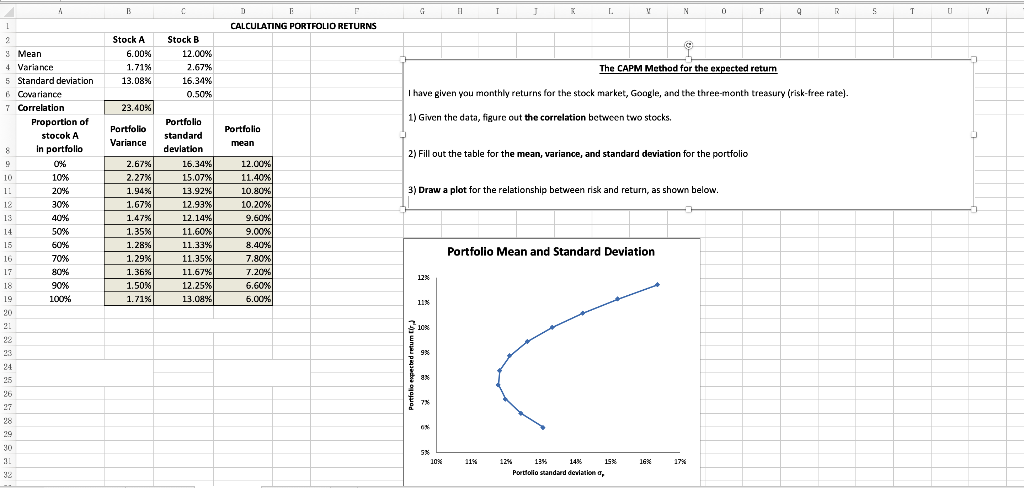
CALCULATING PORTFOLIO RETURNS Stock A 6.00% 1.71% 13.08% Stock B 12.00% 2.67% 16.34% 0.50% The CAPM Method for the expected return I have given you monthly returns for the stock market, Google, and the three-month treasury (risk-free rate). 9 Mean 4 Variance 5 Standard deviation B Cowariance 7 Correlation Proportion of stocok A 8 in portfolio 23.40% 1) Given the data, figure out the correlation between two stocks. Portfolio Variance Portfolio mean 2) Fill out the table for the mean, variance, and standard deviation for the portfolio 10 11 3) Draw a plot for the relationship between risk and return, as shown below. Portfolio standard deviation 16.34% 15,07% 3.924 12.93% 12.149 11.60% 11.33% 10% 20% 30% 40% 50% 60% 70% 80% 12 2.67% 2.273 1.94% 1.67% 1.47% 1.35% 1.28% 12.00% 11.401% 10.80% 10.20% 9.60% 9.00% 8.40% 7.80% 7.20% 6.60% 5.00% Portfolio Mean and Standard Deviation 1.29% 1.36% 11.35% 11.67% 90% 1.50 1.71% 100% 12.25% 3.08% 3.00% , Portfolio expected retum 30 10% 11% 16% 17% 12% 13% 14% Portfolio standard deviation 15% , CALCULATING PORTFOLIO RETURNS Stock A 6.00% 1.71% 13.08% Stock B 12.00% 2.67% 16.34% 0.50% The CAPM Method for the expected return I have given you monthly returns for the stock market, Google, and the three-month treasury (risk-free rate). 9 Mean 4 Variance 5 Standard deviation B Cowariance 7 Correlation Proportion of stocok A 8 in portfolio 23.40% 1) Given the data, figure out the correlation between two stocks. Portfolio Variance Portfolio mean 2) Fill out the table for the mean, variance, and standard deviation for the portfolio 10 11 3) Draw a plot for the relationship between risk and return, as shown below. Portfolio standard deviation 16.34% 15,07% 3.924 12.93% 12.149 11.60% 11.33% 10% 20% 30% 40% 50% 60% 70% 80% 12 2.67% 2.273 1.94% 1.67% 1.47% 1.35% 1.28% 12.00% 11.401% 10.80% 10.20% 9.60% 9.00% 8.40% 7.80% 7.20% 6.60% 5.00% Portfolio Mean and Standard Deviation 1.29% 1.36% 11.35% 11.67% 90% 1.50 1.71% 100% 12.25% 3.08% 3.00% , Portfolio expected retum 30 10% 11% 16% 17% 12% 13% 14% Portfolio standard deviation 15%
Step by Step Solution
There are 3 Steps involved in it

Get step-by-step solutions from verified subject matter experts