

Question: Draw the control chart for the following data. Each 100 meter is an inspection unit. Is the process under control? Sample No Sample Size
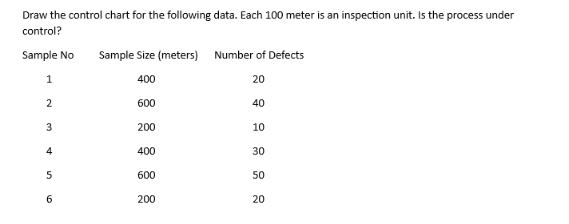
Draw the control chart for the following data. Each 100 meter is an inspection unit. Is the process under control? Sample No Sample Size (meters) Number of Defects 1 400 20 2 600 200 3 4 5 6 400 600 200 40 10 30 50 20
Step by Step Solution
★★★★★
3.39 Rating (152 Votes )
There are 3 Steps involved in it
1 Expert Approved Answer
Step: 1 Unlock

Answer 02 D... View full answer
Question Has Been Solved by an Expert!
Get step-by-step solutions from verified subject matter experts
Step: 2 Unlock
Step: 3 Unlock