

Question: Draw the Gantt chart for the following project using Microsoft Project. The task name and the required time (in days) for each task is shown
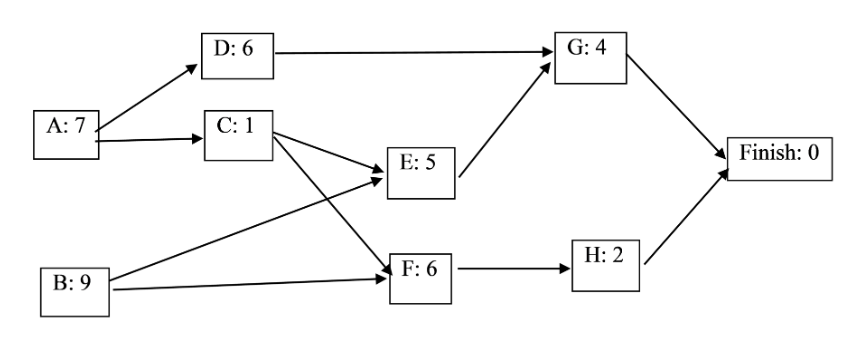
Draw the Gantt chart for the following project using Microsoft Project. The task name and the required time (in days) for each task is shown in the boxes of the network diagram.
What is the expected completion time of the project? Enter the critical path time in the box to the nearest whole number of days (but enter only the number). Remember to submit the Gantt chart.
Step by Step Solution
There are 3 Steps involved in it
1 Expert Approved Answer
Step: 1 Unlock

Question Has Been Solved by an Expert!
Get step-by-step solutions from verified subject matter experts
Step: 2 Unlock
Step: 3 Unlock