

Question: Draw the graph of the sine function y = sin x over the interval [0,2]: (a) Make a table of values using x =
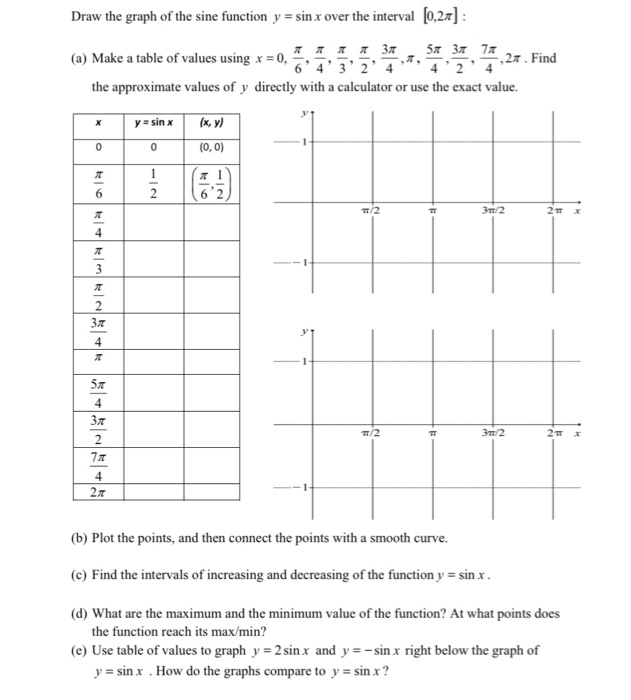
Draw the graph of the sine function y = sin x over the interval [0,2]: (a) Make a table of values using x = 0, 4'2 the approximate values of y directly with a calculator or use the exact value. 30 6'4'3' 2'4 5 3 7 ,2%. Find 4 x y=sin x (x, y) 0 0 (0,0) 6 12 6'2 4 3 2 4 5 4 2 7 4 2 T/2 /2 3/2 2T x T 3m/2 2T x (b) Plot the points, and then connect the points with a smooth curve. (c) Find the intervals of increasing and decreasing of the function y = sin x. (d) What are the maximum and the minimum value of the function? At what points does the function reach its max/min? (e) Use table of values to graph y=2 sin x and y = -sin x right below the graph of y = sin x . How do the graphs compare to y = sin x?
Step by Step Solution
There are 3 Steps involved in it

Get step-by-step solutions from verified subject matter experts