

Question: Draw the project network - Find the project time, critical path, and non-critical activities - Develop the project's Gantt chart with both ES and LS
Draw the project network
- Find the project time, critical path, and non-critical activities
- Develop the project's Gantt chart with both ES and LS times
- Find the probability that the project will be finished in 205 days
- What is your opinion about the probability is there a great risk?
- In your opinion, do you need to make a project crash plan and why?
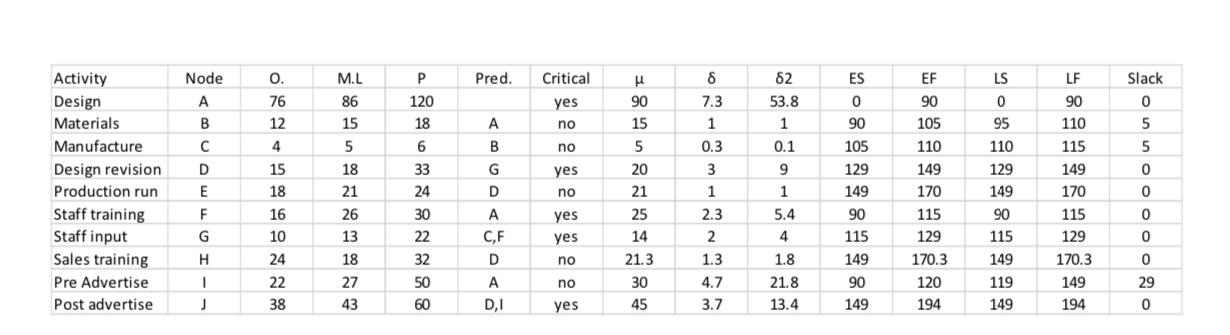
Node A B C D E F G H J M.L P 120 18 6328288 50 Pred. Critical yes G D A D,I yes yes yes no no yes 21.3 30 45 631 1.3 4.7 3.7 82 53.8 1.8 21.8 13.4 129 149 90 115 149 90 149 105 110 149 170 115 129 170.3 120 194 95 110 129 149 90 115 149 119 149 LF 90 110 115 149 170 115 129 170.3 149 194 Slack 0 5 5 0 0 0 0 0 29 0
Step by Step Solution
3.41 Rating (157 Votes )
There are 3 Steps involved in it
Answer To address the tasks youve outlined lets go step by step 1 Draw the project network Heres the network diagram based on the provided data 0 ML A ... View full answer

Get step-by-step solutions from verified subject matter experts