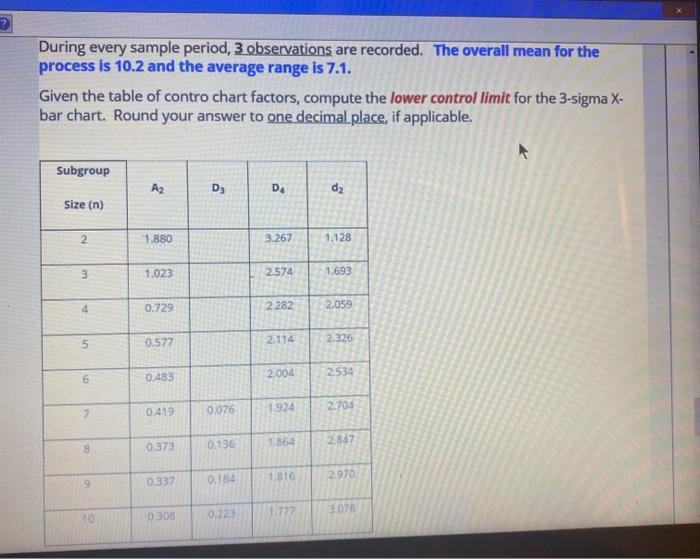
Question: During every sample period, 3 observations are recorded. The overall mean for the process is 10.2 and the average range is 7.1. Given the table

During every sample period, 3 observations are
During every sample period, 3 observations are recorded. The overall mean for the process is 10.2 and the average range is 7.1. Given the table of contro chart factors, compute the lower control limit for the 3-sigma X- bar chart. Round your answer to one decimal place, if applicable. Subgroup A2 D3 D d2 Size (n) 2 1.880 3.267 1.128 3 1.023 2.574 1.693 4 0.729 2.282 2.059 5 5 0.577 2.114 22326 6 0.483 2.004 2.534 1.924 2.704 7 0.076 0.419 0.373 8 0.136 1864 2.847 0.337 2970 0.184 1816 3:07 10 02308 1.773 0.22

Step by Step Solution

There are 3 Steps involved in it

1 Expert Approved Answer
Step: 1 Unlock blur-text-image
Question Has Been Solved by an Expert!

Get step-by-step solutions from verified subject matter experts

Step: 2 Unlock
Step: 3 Unlock

Students Have Also Explored These Related General Management Questions!