

Question: dynamic process control In the figures, both the PI diagram and the block diagram for a control loop regulating the level H in a tank
dynamic process control
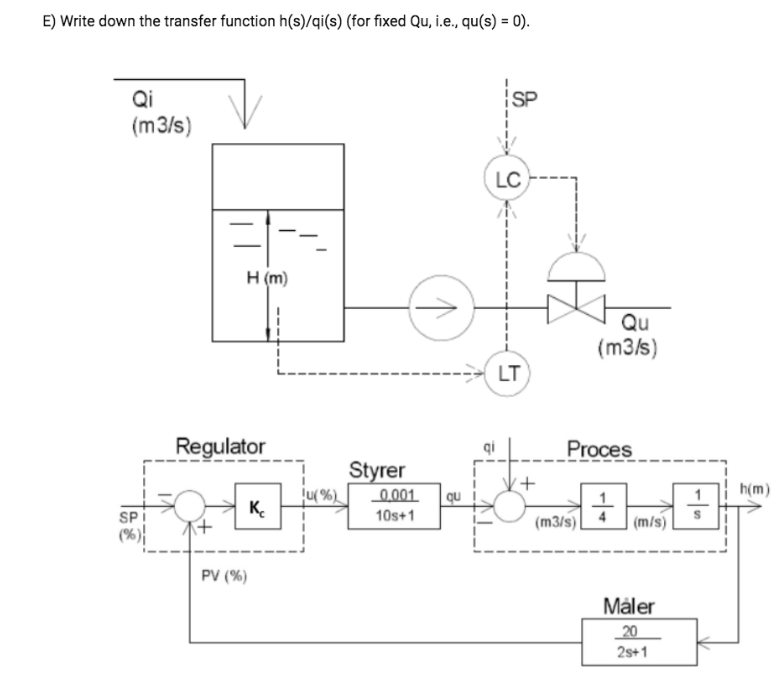
In the figures, both the PI diagram and the block diagram for a control loop regulating the level H in a tank by controlling the outlet flow Qu are shown. Variations in the inlet flow Qi act as disturbances to the system. The signals shown in the block diagram are deviations from steadystate values.
styrer means controls
Mler means measures
The tank is cylindrical with a crosssectional area of m and a total height of m The level transmitter has a measuring range of m meaning it converts H m to PV The time constant of the level transmitter is seconds. The control valve converts the controller signal y to flow Qu ms The time constant of the control valve is seconds. The controller is a proportional controller with gain Kc The bias adjustment is not shown in the block diagram
Answer the following questions:
A Formulate a model for the tanks content and explain, based on the PI diagram at the top, why the 'Process' block in the bottom block diagram has the signals, units, constants, and transfer functions it has!
B How much does the level H m increase after a setpoint SP step of
C If the SP is increased in a step of what stationary error offset occurs on the level H m
D Is the found offset above what you would expect? Explain!
E Write down the transfer function hsqisfor fixed Qu ie qus
Step by Step Solution
There are 3 Steps involved in it
1 Expert Approved Answer
Step: 1 Unlock

Question Has Been Solved by an Expert!
Get step-by-step solutions from verified subject matter experts
Step: 2 Unlock
Step: 3 Unlock