

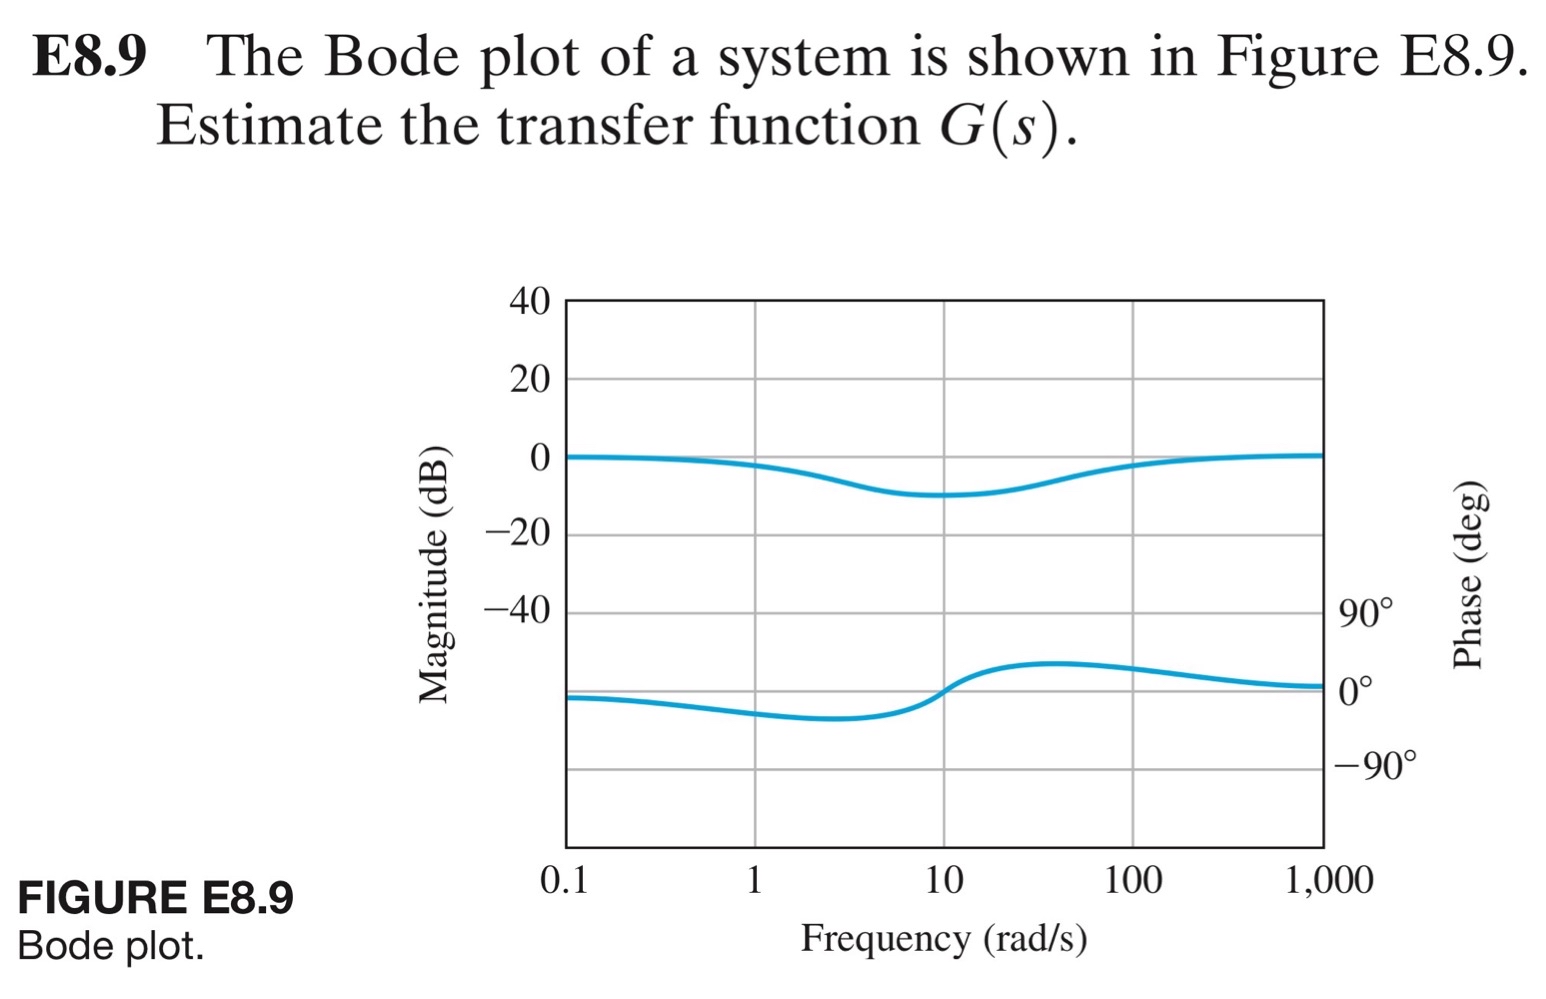
Question: E 8 . 9 The Bode plot of a system is shown in Figure E 8 . 9 . Estimate the transfer function G (
E The Bode plot of a system is shown in Figure E Estimate the transfer function
FIGURE E
Step by Step Solution
There are 3 Steps involved in it
1 Expert Approved Answer
Step: 1 Unlock

Question Has Been Solved by an Expert!
Get step-by-step solutions from verified subject matter experts
Step: 2 Unlock
Step: 3 Unlock