

Question: ( e ) Plot a graph of average inclvidual deloy versus the repair perind. A ir Pertiod i Average Delay ( b ) Average Delay
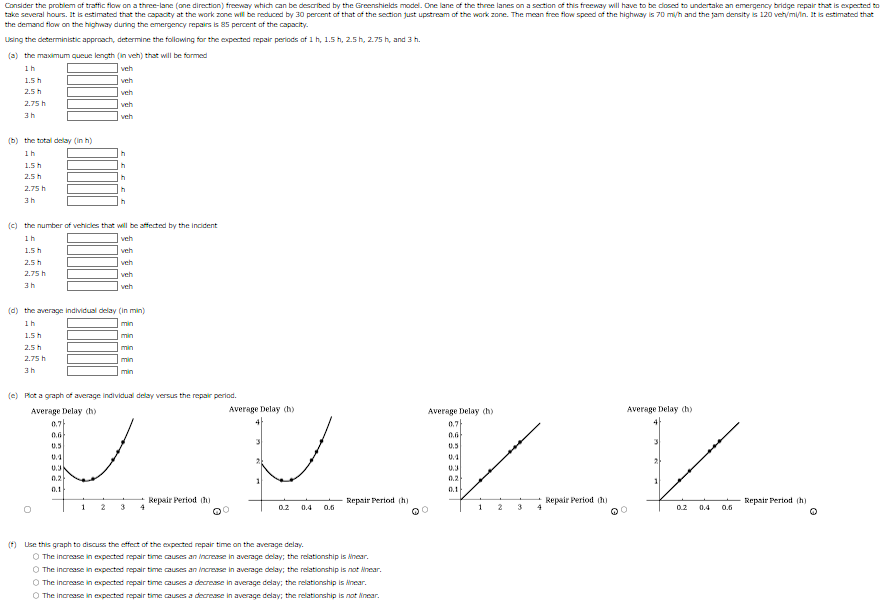
e Plot a graph of average inclvidual deloy versus the repair perind.
A
ir Pertiod i
Average Delay b
Average Delay h
t Use this graph to discuss the effect of the experted repair time on the average delay.
The increase in expected repoir time causes an incrase in average delay; the relationship is Anear.
The increase in expected repair time cuuses an incrasse in average delay; the relationship is nat Ahear.
The increase in expected repsir time causes a decresse in average delay; the relationahip is Ahear.
The increase in expected repsir time cruses a decrease in average delay; the relationahip is not Winear.
Step by Step Solution
There are 3 Steps involved in it
1 Expert Approved Answer
Step: 1 Unlock

Question Has Been Solved by an Expert!
Get step-by-step solutions from verified subject matter experts
Step: 2 Unlock
Step: 3 Unlock