

Question: Python coding with astronomy! The file can be found online on github. Thank you! First Last- Fitting Data In [0]: %matplotlib nline import matplot14b.pyplot as
Python coding with astronomy! The file can be found online on github. Thank you!
![Thank you! First Last- Fitting Data In [0]: %matplotlib nline import matplot14b.pyplot](https://dsd5zvtm8ll6.cloudfront.net/si.experts.images/questions/2024/09/66f015838a21b_17966f015830567e.jpg)
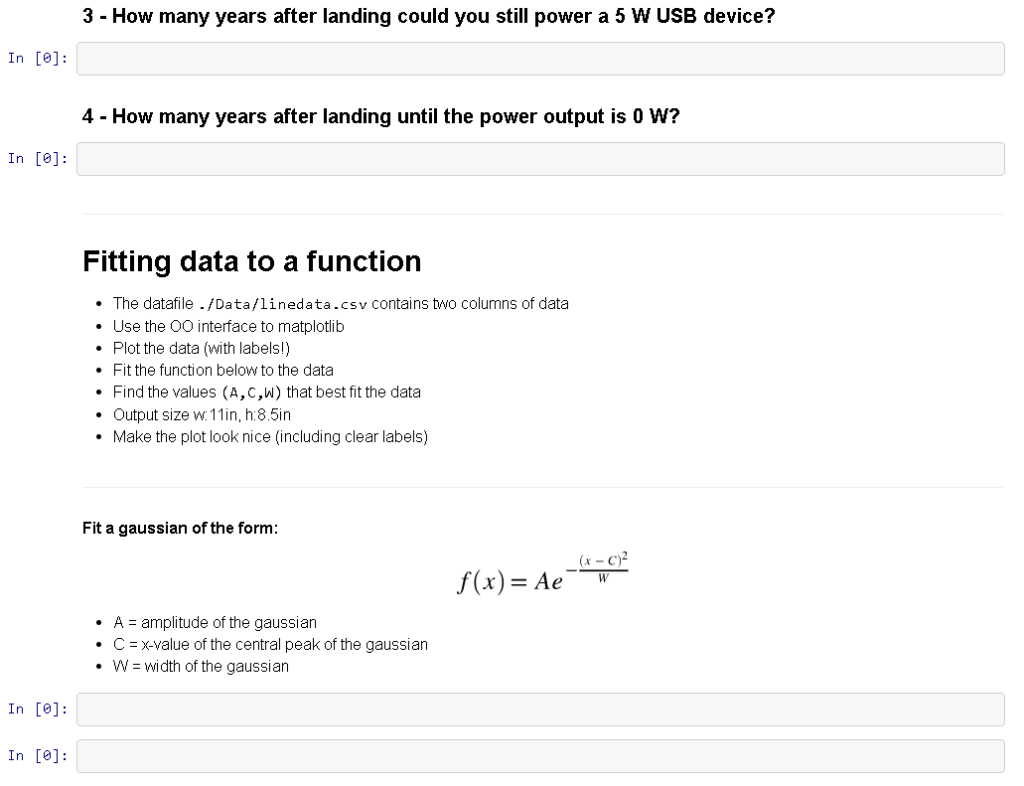
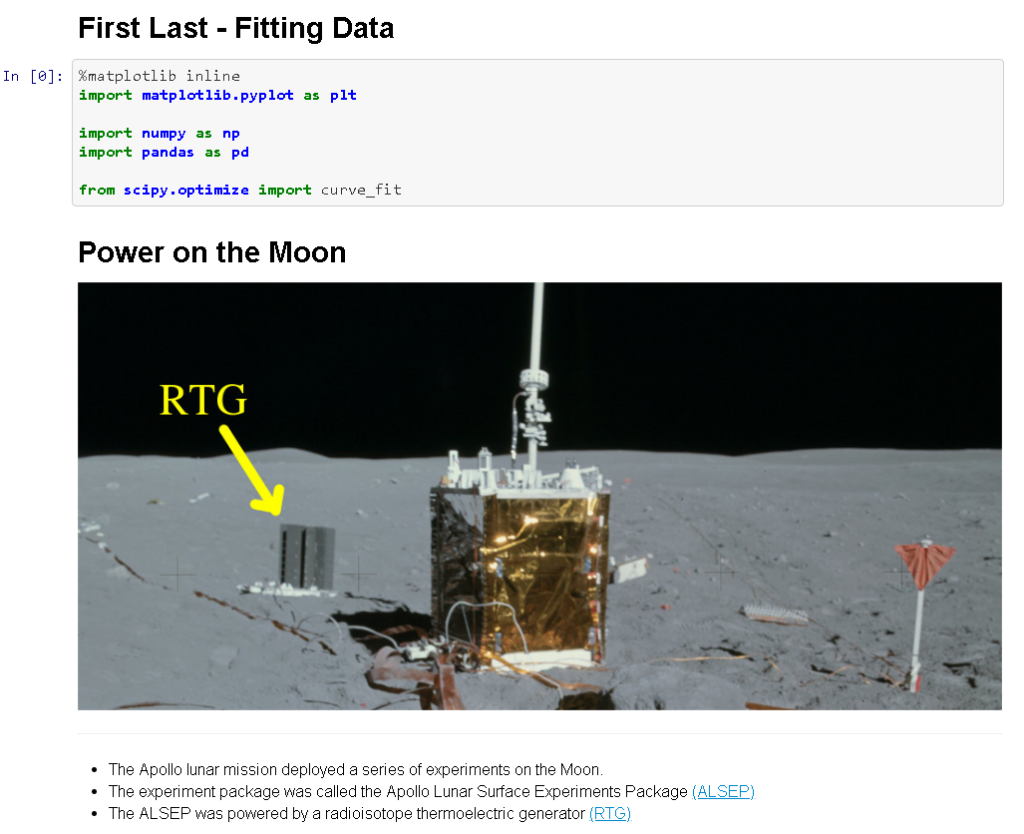
First Last- Fitting Data In [0]: %matplotlib nline import matplot14b.pyplot as p1t import numpy as np import pandas as pd from scipy.optimize import curve fit Power on the Moon RTG The Apollo lunar mission deployed a series of experiments on the Moon. The experiment package was called the Apollo Lunar Surface Experiments Package (ALSEP) The ALSEP was powered by a radioisotope thermoelectric generator (RTG) An RTG is basically a fist-sized slug of Pu-238 wrapped in a material that generates electric power when heated. Since the RTG is powered by a radioisotope, the output power decreases over time as the radioisotope decays. Read in the datafile The data file /Data/Apollo_RTG.csv contains the power output of the Apollo 12 RTG as a function of time. The data colunms are [Day]- Days on the Moon [Power]-RTG power output in Watts In [e]: Plot the Data Day vs. Power Use the OO interface to matplotlib Fit the function with a polynomial (degree> 3) Plot the fit with the data Output size w.11in, h:8.5in Make the plot look nice (including clear labels) In [e]: Power over time All of your answer should be formatted as sentences For example: The power on day is VALUE Watts 1 - What was the power output on Day 0? In [e]: 2 - How many years after landing could you still power a 60 W lightbulb? In [e]: 3 - How many years after landing could you still power a 5 W USB device? In [ej: 4 - How many years after landing until the power output is 0 W? In [0]: Fitting data to a function The datafile . /Data/linedata.csv contains two columns of data Use the OO interface to matplotib Plot the data (with labels) Fit the function below to the data Find the values (A,C,W) that best fit the data Output size w.11in, h.8.5in Make the plot look nice (including clear labels) Fit a gaussian of the form (x - C) ,f(x) = Ae A amplitude of the gaussian Cx-value of the central peak of the gaussian W = Width of the gaussian In [ej: In [e]: First Last- Fitting Data In [0]: %matplotlib nline import matplot14b.pyplot as p1t import numpy as np import pandas as pd from scipy.optimize import curve fit Power on the Moon RTG The Apollo lunar mission deployed a series of experiments on the Moon. The experiment package was called the Apollo Lunar Surface Experiments Package (ALSEP) The ALSEP was powered by a radioisotope thermoelectric generator (RTG) An RTG is basically a fist-sized slug of Pu-238 wrapped in a material that generates electric power when heated. Since the RTG is powered by a radioisotope, the output power decreases over time as the radioisotope decays. Read in the datafile The data file /Data/Apollo_RTG.csv contains the power output of the Apollo 12 RTG as a function of time. The data colunms are [Day]- Days on the Moon [Power]-RTG power output in Watts In [e]: Plot the Data Day vs. Power Use the OO interface to matplotlib Fit the function with a polynomial (degree> 3) Plot the fit with the data Output size w.11in, h:8.5in Make the plot look nice (including clear labels) In [e]: Power over time All of your answer should be formatted as sentences For example: The power on day is VALUE Watts 1 - What was the power output on Day 0? In [e]: 2 - How many years after landing could you still power a 60 W lightbulb? In [e]: 3 - How many years after landing could you still power a 5 W USB device? In [ej: 4 - How many years after landing until the power output is 0 W? In [0]: Fitting data to a function The datafile . /Data/linedata.csv contains two columns of data Use the OO interface to matplotib Plot the data (with labels) Fit the function below to the data Find the values (A,C,W) that best fit the data Output size w.11in, h.8.5in Make the plot look nice (including clear labels) Fit a gaussian of the form (x - C) ,f(x) = Ae A amplitude of the gaussian Cx-value of the central peak of the gaussian W = Width of the gaussian In [ej: In [e]
Step by Step Solution
There are 3 Steps involved in it

Get step-by-step solutions from verified subject matter experts