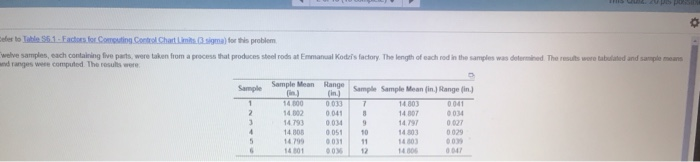
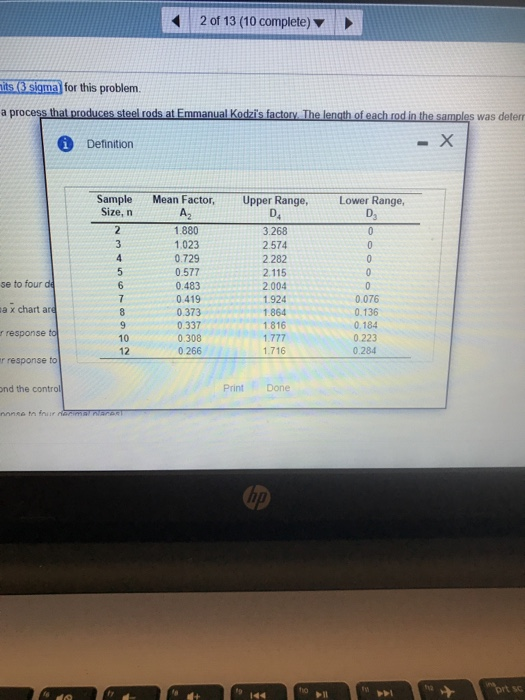
Question: ees to Tole 561. Factors for Computing Control Charts sigma) for this problem welve samples, each containing live parts were taken from a process that

ees to Tole 561. Factors for Computing Control
ees to Tole 561. Factors for Computing Control Charts sigma) for this problem welve samples, each containing live parts were taken from a process that produces steel rods at Emmanuel Kader's factory. The length of each rod in the samples was determined. The results were tabulated and sample means in ranges were computed. The results were Sample Mean Range Sample 1 2 3 4 5 6 14.300 14.002 14.793 14.303 14799 14301 0.033 0.041 0.034 0051 0031 COM Sample Sample Mean (in.) Range (in.) 7 14803 0.041 8 14 307 0034 9 14.797 10 14303 11 14.30 DO 14.00 2 of 13 (10 complete) nits (Sigma) for this problem. a process that produces steel rods at Emmanual Kodzi's factory. The length of each rod in the samples was deterr 1 Definition - X Sample Size, in 2 3 4 5 6 7 Mean Factor, Az 1.880 1.023 0.729 0.577 0.483 0.419 0.373 0.337 0.308 0 266 Upper Range, D 3.268 2.574 2.282 2. 115 2.004 1.924 1.864 1.816 1.777 1.716 Lower Range, D 0 0 0 0 0 0.076 0.136 0.184 0223 0.284 se to four de a x chart are co response to 9 10 12 response to ond the control Print Done no in nur PT hp prt so This Question: 3 pts 20 0 3 4 0 14.793 14.808 14.799 14.801 5 0 0. 6 For the given data, the x = inches (round your response to four decimal places). Based on the sampling done, the control limits for 3-sigma x chart are: Upper Control Limit (UCL) - inches (round your response to four decimal places). Lower Control Limit (LCL;) - inches (round your response to four decimal places). Based on the x-chart, is one or more samples beyond the control limits? For the given data, the R = inches (round your response to four decimals The control limits for the 3-sigma R-chart are: Upper Control Limit (UCLR) - inches (round your response to four decimal places) Lower Control Limit (LCL ) inches (round your response to four decimal places). No Yes Based on the R-chart, is one or more samples beyond the control limits? Enter your answer in each of the answer boxes esc ? 0 a # $ % 1 2 3 4 5 ca

Step by Step Solution

There are 3 Steps involved in it

1 Expert Approved Answer
Step: 1 Unlock blur-text-image
Question Has Been Solved by an Expert!

Get step-by-step solutions from verified subject matter experts

Step: 2 Unlock
Step: 3 Unlock

Students Have Also Explored These Related General Management Questions!