

Efficient Portfolios with Twelve Stocks Today is April 30, 2012, and you have just started your...
Fantastic news! We've Found the answer you've been seeking!
Question:
Transcribed Image Text:
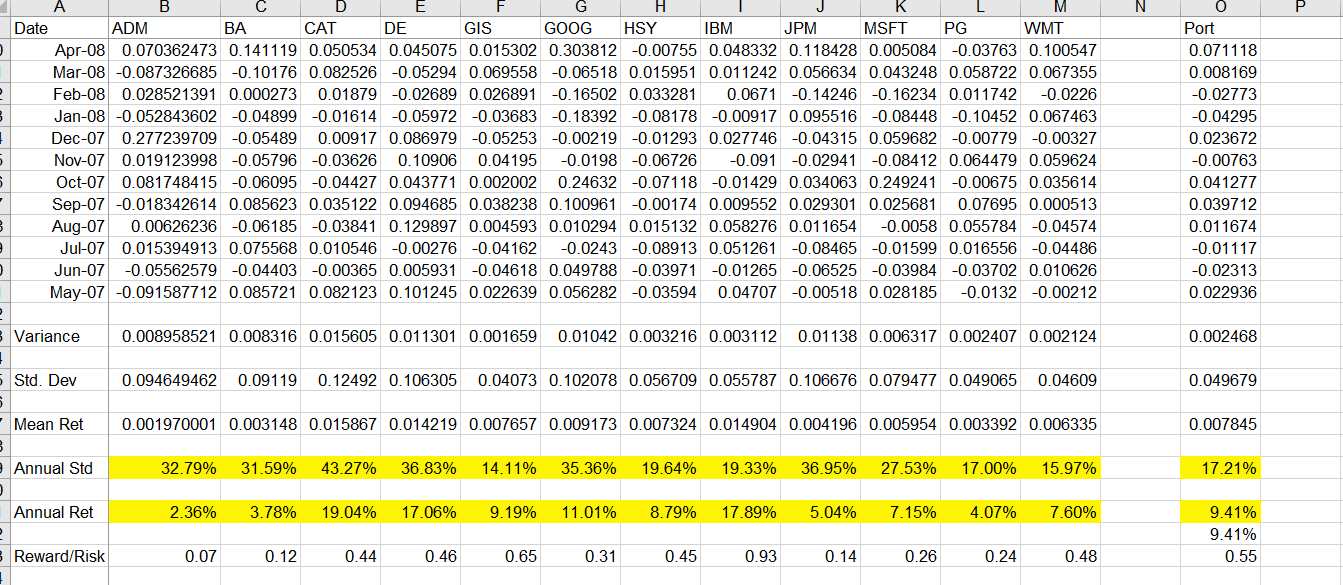
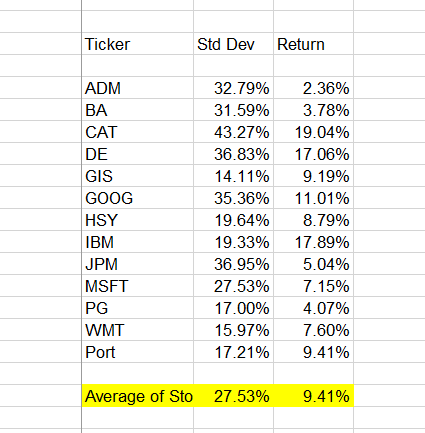
Efficient Portfolios with Twelve Stocks Today is April 30, 2012, and you have just started your new job with a financial planning firm. In addition to studying for all your license-exams, you have been asked to review a portion of a client's stock portfolio to determine the risk/return profiles of 12 stocks in the portfolio. The stocks (with their symbols in parentheses) are: 1. Archer Daniels Midland (ADM) 2. Boeing (BA) 3. Caterpillar (CAT) 4. Deere & Co. (DE) 5. General Mills, Inc. (GIS) 6. Google Inc. (GOOG) 7. Hershey (HSY) 8. International Business Machines Corporation (IBM) 9. JP Morgan Chase & Co. (JPM) 10. Microsoft (MSFT) 11. Procter and Gamble (PG) 12. Wal-Mart (WMT) The price information for each stock is collected from Yahoo! Finance, which is given in the attached Excel file. Your manager wants you to update the stock portfolio by rebalancing the portfolio with the optimum weights that will provide the best risk and return combinations for the 12-stock portfolio. 1. Begin with the equally weighted portfolio. Establish the portfolio returns for the stocks in the portfolio using a formula that depends on the portfolio weights. Initially, these weights will all equal to 1/12. You would like to allow the portfolio weights to vary, so you will need to list the weights for each stock in separate cells and establish another cell that sums the weights of the stocks. The portfolio returns for each month must reference these weights for Excel Solver to be useful. 2. Compute the values for the monthly mean return and standard deviation of the port- folio. Convert these values to annual numbers for easier interpretation (multiply_the mean monthly return by 12, and multiply the monthly standard deviaiton by √12). 3. Compute the efficient frontier when short sales are not allowed. Use the Solver tool in Excel (on the Data tab in the analysis section). To set the Solver parameters: (a) Set the target cell as the cell of interest, making it the cell that computes the (annual) portfolio standard deviation. Minimize this value. (b) Establish the "By Changing Cells" by holding the Control key and clicking in each of the 12 cells containing the weights of each stock. (c) Add constraints by clicking the Add button next to the "Subject to the Con- straints" box. One set of constraints will be the weight of each stock that is greater than or equal to zero. Calculate the constraints individually. A second constraint is that the weights will sum to one. (d) Compute the portfolio with the lowest standard deviation. If the parameters are set correctly, you should get a solution when you click "Solve." If there is an error, you will need to double-check the parameters, especially the constraints. 4. Next, compute portfolios that have the lowest standard deviation for a target level of the expected return. (a) Start by finding the portfolio with an expected return 2% higher than that of the minimum variance portfolio. To do this, add a constraint that the (annual) portfolio return equals this target level. Click "Solve" and record the standard deviation and mean return of the solution (and be sure the mean return equals target if not, check your constraint). (b) Repeat step (a) raising the target return in 2% increments, recording the result for each step. Continue to increase the target return and record the result until Solver can no longer find a solution. (c) At what level does Solver fail to find a solution? Why? 5. Plot the efficient frontier with the constraint of no short sales. To do this, create an XY Scatter Plot, with portfolio standard deviation on the x-axis and the return on the y-axis, using the data for the minimum variance portfolio and the portfolios you computed in step 4. How do these portfolios compare to the mean and standard deviation for the equally weighted portfolio? 6. Redo your analysis to allow for short sales by removing the constraint that each portfolio weight is greater than or equal to zero. Use Solver to calculate the (annual) portfolio standard deviation for the minimum variance portfolio, and when the annula portfolio return are set to 5%, 10%, 20%, 30%, and 40%. Plot the unconstrained efficient frontier on an XY Scatter Plot. How does allowing short sales affect the frontier? 2 7. Redo your analysis adding a new risk-free security that has a return of 0.5% each month. Include a weight for this security when calculating the monthly portfolio returns. That is, there will now be 13 weights, one for each of the 12 stocks and one for the risk-free security. Again, these weights must sum to one. Allow for short sales, and use Solver to calculate the (annual) portfolio standard deviation when the annual portfolio returns are set to 5%, 10%, 20%, 30%, and 40%. Plot the results on the same XY Scatter Plot, and in addition keep track of the portfolio weights of the optimal portfolio. What do you notice about the relative weights of the different stocks in the portfolio as you change the target return? Can you identify the tangent portfolio? A B C D E F Date ADM BA CAT DE GIS G GOOG HSY H IBM 0 Apr-08 2 + 5 3 ) JPM K MSFT PG M N P WMT Port 0.071118 0.008169 -0.02773 -0.04295 0.070362473 0.141119 0.050534 0.045075 0.015302 0.303812 -0.00755 0.048332 0.118428 0.005084 -0.03763 0.100547 Mar-08 -0.087326685 -0.10176 0.082526 -0.05294 0.069558 -0.06518 0.015951 0.011242 0.056634 0.043248 0.058722 0.067355 Feb-08 0.028521391 0.000273 0.01879 -0.02689 0.026891 -0.16502 0.033281 0.0671 -0.14246 -0.16234 0.011742 -0.0226 Jan-08 -0.052843602 -0.04899 -0.01614 -0.05972 -0.03683 -0.18392 -0.08178 -0.00917 0.095516 -0.08448 -0.10452 0.067463 Dec-07 0.277239709 -0.05489 0.00917 0.086979 -0.05253 -0.00219 -0.01293 0.027746 -0.04315 0.059682 -0.00779 -0.00327 Nov-07 0.019123998 -0.05796 -0.03626 0.10906 0.04195 -0.0198 -0.06726 -0.091 -0.02941 -0.08412 0.064479 0.059624 Oct-07 0.081748415 -0.06095 -0.04427 0.043771 0.002002 0.24632 -0.07118 -0.01429 0.034063 0.249241 -0.00675 0.035614 Sep-07 -0.018342614 0.085623 0.035122 0.094685 0.038238 0.100961 -0.00174 0.009552 0.029301 0.025681 0.07695 0.000513 Aug-07 0.00626236 -0.06185 -0.03841 0.129897 0.004593 0.010294 0.015132 0.058276 0.011654 -0.0058 0.055784 -0.04574 Jul-07 0.015394913 0.075568 0.010546 -0.00276 -0.04162 -0.0243 -0.08913 0.051261 -0.08465 -0.01599 0.016556 -0.04486 Jun-07 -0.05562579 -0.04403 -0.00365 0.005931 -0.04618 0.049788 -0.03971 -0.01265 -0.06525 -0.03984 -0.03702 0.010626 May-07 -0.091587712 0.085721 0.082123 0.101245 0.022639 0.056282 -0.03594 0.04707 -0.00518 0.028185 -0.0132 -0.00212 0.023672 -0.00763 0.041277 0.039712 0.011674 -0.01117 -0.02313 0.022936 0.002468 0.049679 Variance 0.008958521 0.008316 0.015605 0.011301 0.001659 0.01042 0.003216 0.003112 0.01138 0.006317 0.002407 0.002124 + 5 Std. Dev 0.094649462 0.09119 0.12492 0.106305 0.04073 0.102078 0.056709 0.055787 0.106676 0.079477 0.049065 0.04609 5 Mean Ret 0.001970001 0.003148 0.015867 0.014219 0.007657 0.009173 0.007324 0.014904 0.004196 0.005954 0.003392 0.006335 0.007845 B Annual Std 32.79% 31.59% 43.27% 36.83% 14.11% 35.36% 19.64% 19.33% 36.95% 27.53% 17.00% 15.97% 17.21% ) Annual Ret 2.36% 3.78% 19.04% 17.06% 9.19% 11.01% 8.79% 17.89% 5.04% 7.15% 4.07% 7.60% 9.41% P 9.41% Reward/Risk 0.07 0.12 0.44 0.46 0.65 0.31 0.45 0.93 0.14 0.26 0.24 0.48 0.55 Ticker Std Dev Return ADM 32.79% 2.36% BA 31.59% 3.78% CAT 43.27% 19.04% DE 36.83% 17.06% GIS 14.11% 9.19% GOOG 35.36% 11.01% HSY 19.64% 8.79% IBM 19.33% 17.89% JPM 36.95% 5.04% MSFT 27.53% 7.15% PG 17.00% 4.07% WMT 15.97% 7.60% Port 17.21% 9.41% Average of Sto 27.53% 9.41% Efficient Portfolios with Twelve Stocks Today is April 30, 2012, and you have just started your new job with a financial planning firm. In addition to studying for all your license-exams, you have been asked to review a portion of a client's stock portfolio to determine the risk/return profiles of 12 stocks in the portfolio. The stocks (with their symbols in parentheses) are: 1. Archer Daniels Midland (ADM) 2. Boeing (BA) 3. Caterpillar (CAT) 4. Deere & Co. (DE) 5. General Mills, Inc. (GIS) 6. Google Inc. (GOOG) 7. Hershey (HSY) 8. International Business Machines Corporation (IBM) 9. JP Morgan Chase & Co. (JPM) 10. Microsoft (MSFT) 11. Procter and Gamble (PG) 12. Wal-Mart (WMT) The price information for each stock is collected from Yahoo! Finance, which is given in the attached Excel file. Your manager wants you to update the stock portfolio by rebalancing the portfolio with the optimum weights that will provide the best risk and return combinations for the 12-stock portfolio. 1. Begin with the equally weighted portfolio. Establish the portfolio returns for the stocks in the portfolio using a formula that depends on the portfolio weights. Initially, these weights will all equal to 1/12. You would like to allow the portfolio weights to vary, so you will need to list the weights for each stock in separate cells and establish another cell that sums the weights of the stocks. The portfolio returns for each month must reference these weights for Excel Solver to be useful. 2. Compute the values for the monthly mean return and standard deviation of the port- folio. Convert these values to annual numbers for easier interpretation (multiply_the mean monthly return by 12, and multiply the monthly standard deviaiton by √12). 3. Compute the efficient frontier when short sales are not allowed. Use the Solver tool in Excel (on the Data tab in the analysis section). To set the Solver parameters: (a) Set the target cell as the cell of interest, making it the cell that computes the (annual) portfolio standard deviation. Minimize this value. (b) Establish the "By Changing Cells" by holding the Control key and clicking in each of the 12 cells containing the weights of each stock. (c) Add constraints by clicking the Add button next to the "Subject to the Con- straints" box. One set of constraints will be the weight of each stock that is greater than or equal to zero. Calculate the constraints individually. A second constraint is that the weights will sum to one. (d) Compute the portfolio with the lowest standard deviation. If the parameters are set correctly, you should get a solution when you click "Solve." If there is an error, you will need to double-check the parameters, especially the constraints. 4. Next, compute portfolios that have the lowest standard deviation for a target level of the expected return. (a) Start by finding the portfolio with an expected return 2% higher than that of the minimum variance portfolio. To do this, add a constraint that the (annual) portfolio return equals this target level. Click "Solve" and record the standard deviation and mean return of the solution (and be sure the mean return equals target if not, check your constraint). (b) Repeat step (a) raising the target return in 2% increments, recording the result for each step. Continue to increase the target return and record the result until Solver can no longer find a solution. (c) At what level does Solver fail to find a solution? Why? 5. Plot the efficient frontier with the constraint of no short sales. To do this, create an XY Scatter Plot, with portfolio standard deviation on the x-axis and the return on the y-axis, using the data for the minimum variance portfolio and the portfolios you computed in step 4. How do these portfolios compare to the mean and standard deviation for the equally weighted portfolio? 6. Redo your analysis to allow for short sales by removing the constraint that each portfolio weight is greater than or equal to zero. Use Solver to calculate the (annual) portfolio standard deviation for the minimum variance portfolio, and when the annula portfolio return are set to 5%, 10%, 20%, 30%, and 40%. Plot the unconstrained efficient frontier on an XY Scatter Plot. How does allowing short sales affect the frontier? 2 7. Redo your analysis adding a new risk-free security that has a return of 0.5% each month. Include a weight for this security when calculating the monthly portfolio returns. That is, there will now be 13 weights, one for each of the 12 stocks and one for the risk-free security. Again, these weights must sum to one. Allow for short sales, and use Solver to calculate the (annual) portfolio standard deviation when the annual portfolio returns are set to 5%, 10%, 20%, 30%, and 40%. Plot the results on the same XY Scatter Plot, and in addition keep track of the portfolio weights of the optimal portfolio. What do you notice about the relative weights of the different stocks in the portfolio as you change the target return? Can you identify the tangent portfolio? A B C D E F Date ADM BA CAT DE GIS G GOOG HSY H IBM 0 Apr-08 2 + 5 3 ) JPM K MSFT PG M N P WMT Port 0.071118 0.008169 -0.02773 -0.04295 0.070362473 0.141119 0.050534 0.045075 0.015302 0.303812 -0.00755 0.048332 0.118428 0.005084 -0.03763 0.100547 Mar-08 -0.087326685 -0.10176 0.082526 -0.05294 0.069558 -0.06518 0.015951 0.011242 0.056634 0.043248 0.058722 0.067355 Feb-08 0.028521391 0.000273 0.01879 -0.02689 0.026891 -0.16502 0.033281 0.0671 -0.14246 -0.16234 0.011742 -0.0226 Jan-08 -0.052843602 -0.04899 -0.01614 -0.05972 -0.03683 -0.18392 -0.08178 -0.00917 0.095516 -0.08448 -0.10452 0.067463 Dec-07 0.277239709 -0.05489 0.00917 0.086979 -0.05253 -0.00219 -0.01293 0.027746 -0.04315 0.059682 -0.00779 -0.00327 Nov-07 0.019123998 -0.05796 -0.03626 0.10906 0.04195 -0.0198 -0.06726 -0.091 -0.02941 -0.08412 0.064479 0.059624 Oct-07 0.081748415 -0.06095 -0.04427 0.043771 0.002002 0.24632 -0.07118 -0.01429 0.034063 0.249241 -0.00675 0.035614 Sep-07 -0.018342614 0.085623 0.035122 0.094685 0.038238 0.100961 -0.00174 0.009552 0.029301 0.025681 0.07695 0.000513 Aug-07 0.00626236 -0.06185 -0.03841 0.129897 0.004593 0.010294 0.015132 0.058276 0.011654 -0.0058 0.055784 -0.04574 Jul-07 0.015394913 0.075568 0.010546 -0.00276 -0.04162 -0.0243 -0.08913 0.051261 -0.08465 -0.01599 0.016556 -0.04486 Jun-07 -0.05562579 -0.04403 -0.00365 0.005931 -0.04618 0.049788 -0.03971 -0.01265 -0.06525 -0.03984 -0.03702 0.010626 May-07 -0.091587712 0.085721 0.082123 0.101245 0.022639 0.056282 -0.03594 0.04707 -0.00518 0.028185 -0.0132 -0.00212 0.023672 -0.00763 0.041277 0.039712 0.011674 -0.01117 -0.02313 0.022936 0.002468 0.049679 Variance 0.008958521 0.008316 0.015605 0.011301 0.001659 0.01042 0.003216 0.003112 0.01138 0.006317 0.002407 0.002124 + 5 Std. Dev 0.094649462 0.09119 0.12492 0.106305 0.04073 0.102078 0.056709 0.055787 0.106676 0.079477 0.049065 0.04609 5 Mean Ret 0.001970001 0.003148 0.015867 0.014219 0.007657 0.009173 0.007324 0.014904 0.004196 0.005954 0.003392 0.006335 0.007845 B Annual Std 32.79% 31.59% 43.27% 36.83% 14.11% 35.36% 19.64% 19.33% 36.95% 27.53% 17.00% 15.97% 17.21% ) Annual Ret 2.36% 3.78% 19.04% 17.06% 9.19% 11.01% 8.79% 17.89% 5.04% 7.15% 4.07% 7.60% 9.41% P 9.41% Reward/Risk 0.07 0.12 0.44 0.46 0.65 0.31 0.45 0.93 0.14 0.26 0.24 0.48 0.55 Ticker Std Dev Return ADM 32.79% 2.36% BA 31.59% 3.78% CAT 43.27% 19.04% DE 36.83% 17.06% GIS 14.11% 9.19% GOOG 35.36% 11.01% HSY 19.64% 8.79% IBM 19.33% 17.89% JPM 36.95% 5.04% MSFT 27.53% 7.15% PG 17.00% 4.07% WMT 15.97% 7.60% Port 17.21% 9.41% Average of Sto 27.53% 9.41%
Expert Answer:
Answer rating: 100% (QA)
Based on the provided data we have monthly returns for 12 stocks along with their corresponding statistics Well use this information to compute portfo... View the full answer

Related Book For 

Fundamentals Of Corporate Finance
ISBN: 9780135811603
5th Edition
Authors: Jonathan Berk, Peter DeMarzo, Jarrad Harford
Posted Date:
Students also viewed these finance questions
-
Today is March 29, 2019, and you have just started your new job with a financial planning firm. In addition to studying for all your license exams, you have been asked to review a portion of a...
-
Today is April 30, 2012, and you have just started your new job with a financial planning firm. In addition to studying for all your license exams, you have been asked to review a portion of a...
-
Write a program for setting three bits of an unsigned char to 1. The function set 3bits should have four parameters: the unsigned char to be changed and the three bits which are to be set to 1. For...
-
How's a Ch.7 bankruptcy compare to a Ch.13 bankruptcy? There are many advantages to using credit, in general; however, there are also several disadvantages. Regarding advantages, credit allows for...
-
Financial information for American Eagle is presented in Appendix A at the end of the book, and financial information for Buckle is presented in Appendix B at the end of the book. Required: 1. Which...
-
Did the salesperson understand the motives behind the purchase? If not, why not? Did they make any other mistakes?
-
Wittmann Co. began operations on July 1. It uses a perpetual inventory system. During July, the company had the following purchases and sales. Instructions (a) Determine the ending inventory under a...
-
(14%) Problem 1: A uniform electric field of magnitude 46.6 N/C is parallel to the x axis. A circular loop of radius 28.2 cm is centered at the origin with the normal to the loop pointing 12.4 above...
-
American Surety and Fidelity buys and sells securities expecting to earn profits on short-term differences in price. For the first 11 months of 2024, gains from selling trading securities totaled $8...
-
Topco, Inc. reflected total U.S. federal taxable income of $85,000,000 for the 2019 tax year. Components of U.S. federal taxable income include: interest income of $1,500,000, tax depreciation of...
-
A train on a straight track sounds a 400 Hz horn when passing a parked car on the road. The train is moving at 20 m/s and the temperature is 10C. Find the apparent frequency of the horn for a person...
-
At a distance of 0 . 1 8 6 cm from the axis of a very long charged conducting cylinder with radius 0 . 1 0 0 cm , the electric field is 4 4 5 N / C . What is the electric field 0 . 6 1 6 cm from the...
-
once a customer has identified a need, two questions arise - what information is required to satisfy the need, and 1. how important is the need? 2. where can i get the information? 3. when does the...
-
(10 points) Marketing Message: Describe the message you plan to communicate to the target market. This should be a focused message that explains the benefits of the product/event in a way that...
-
Since products are very similar across the whole online-gifting industry? How could Flowaura differentiate itself as unique or a better choice for customers? How can the brand reduce the number of...
-
Consider a retail gasoline market. Assume the following throughout your analysis: (i) a retailers variable cost of supplying a gallon of gas is $0.10 plus the wholesale price of the gallon; (ii)...
-
Refer to the table to answer the following questions. Year Nominal GDP (in billions) Total Federal Spending (in billions) Real GDP (in billions) Real Federal Spending (in billions) 2000 9,817 578...
-
Nokela Industries purchases a $40 million cyclo-converter. The cyclo-converter will be depreciated by $10 million per year over four years, starting this year. Suppose Nokelas tax rate is 25%. a....
-
Nirvana Chip Designs has finished designing its next generation of chips, the XJ5000 series and is getting ready to start production. As the analyst on the project, you are required to prepare pro...
-
Consider a 10-year bond with a face value of $1000 that has a coupon rate of 5.5%, with semiannual payments. a. What is the coupon payment for this bond? b. Draw the cash flows for the bond on a...
-
Show that for two arbitrary random events \(A\) and \(B\) the following inequalities are true: \(P(A \cap B) \leq P(A) \leq P(A \cup B) \leq P(A)+P(B)\).
-
A publishing house offers a new book as standard or luxury edition and with or without a CD. The publisher analyzes the first 1000 orders: Let \(A(B)\) the random event that a book, randomly choosen...
-
Two dice are simultaneously thrown. The result is \(\left(\omega_{1}, \omega_{2} ight)\). What is the probability \(p\) of the event ' \(\omega_{2}=6\) ' on condition that '...

Study smarter with the SolutionInn App