

Question: Excel Case #2 - Texas Instruments, Inc. Answer Schedule Format Market value of equity (market cap) billion currency, 3 decimal places Growth rate for equity
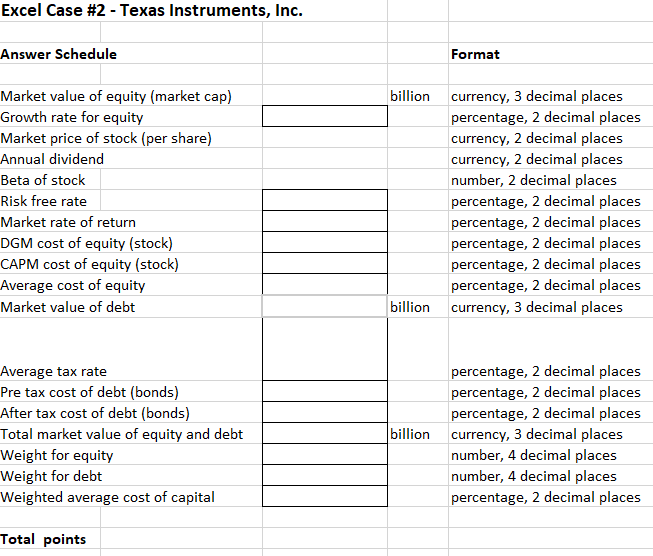

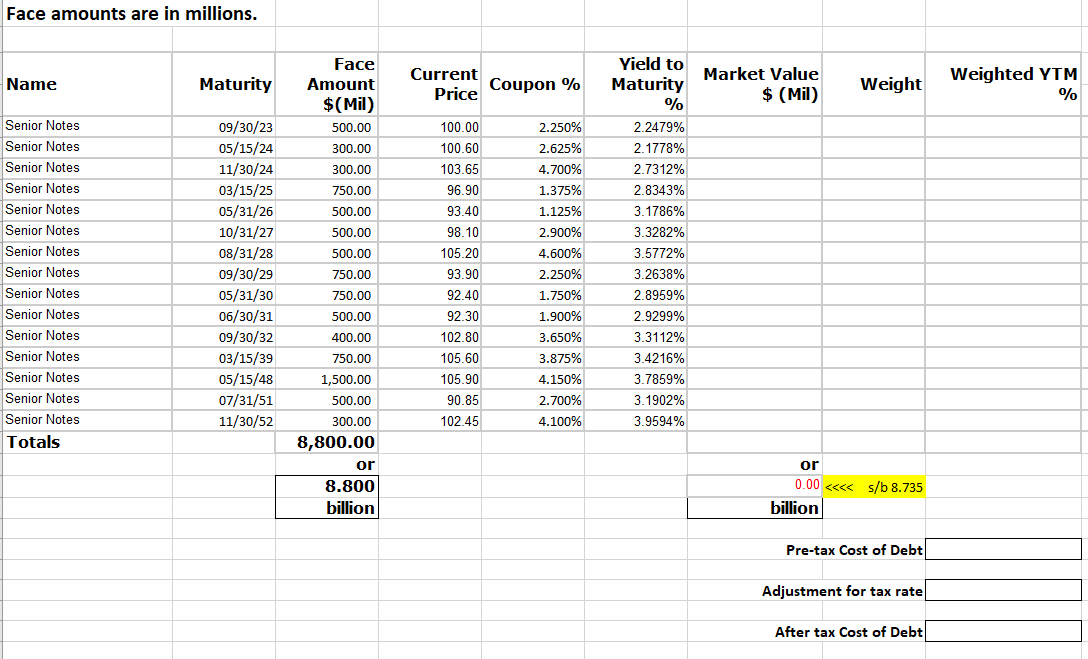
Excel Case #2 - Texas Instruments, Inc. Answer Schedule Format Market value of equity (market cap) billion currency, 3 decimal places Growth rate for equity percentage, 2 decimal places Market price of stock (per share) currency, 2 decimal places Annual dividend currency, 2 decimal places Beta of stock number, 2 decimal places Risk free rate percentage, 2 decimal places Market rate of return percentage, 2 decimal places DGM cost of equity (stock) percentage, 2 decimal places CAPM cost of equity (stock) percentage, 2 decimal places Average cost of equity percentage, 2 decimal places Market value of debt billion currency, 3 decimal places Average tax rate percentage, 2 decimal places Pre tax cost of debt (bonds) percentage, 2 decimal places After tax cost of debt (bonds) percentage, 2 decimal places Total market value of equity and debt billion currency, 3 decimal places Weight for equity number, 4 decimal places Weight for debt number, 4 decimal places Weighted average cost of capital percentage, 2 decimal places Total points Data Texas Instruments, Inc. yahoo finance data 12/31/22 (year end) Date Quarterly Dividends Annual Dividends Annual Growth Rates Average Growth Rate 10/28/22 1.24 07/29/22 1.15 Current stock price $165.22 05/06/22 1.15 Market Cap (Value) $149.689 billion 01/28/22 1.15 Beta 1.12 10/29/21 1.15 PE Ratio 17.56 07/23/21 1.02 EPS $9.41 04/30/21 1.02 Annual dividend $4.69 01/29/21 1.02 # of shares outstanding 906.000 million 10/29/20 1.02 07/30/20 0.90 05/01/20 0.90 current price $165.22 01/30/20 0.90 outstanding shares 906,000,000 10/30/19 0.90 market value $149,689,320,000 07/30/19 0.77 or 05/01/19 0.77 $149.689 billion 01/30/19 0.77 10/30/18 0.77 07/30/18 0.62 05/04/18 0.62 01/30/18 0.62 10/30/17 0.62 07/27/17 0.50 04/27/17 0.50 01/27/17 0.50 Bond Schedule Face amounts are in millions. Name Maturity Face Amount $(Mil) Current Price Coupon % Yield to Maturity % Market Value $ (Mil) Weight Weighted YTM % Senior Notes 09/30/23 500.00 100.00 2.250% 2.2479% Senior Notes 05/15/24 300.00 100.60 2.625% 2.1778% Senior Notes 11/30/24 300.00 103.65 4.700% 2.7312% Senior Notes 03/15/25 750.00 96.90 1.375% 2.8343% Senior Notes 05/31/26 500.00 93.40 1.125% 3.1786% Senior Notes 10/31/27 500.00 98.10 2.900% 3.3282% Senior Notes 08/31/28 500.00 105.20 4.600% 3.5772% Senior Notes 09/30/29 750.00 93.90 2.250% 3.2638% Senior Notes 05/31/30 750.00 92.40 1.750% 2.8959% Senior Notes 06/30/31 500.00 92.30 1.900% 2.9299% Senior Notes 09/30/32 400.00 102.80 3.650% 3.3112% Senior Notes 03/15/39 750.00 105.60 3.875% 3.4216% Senior Notes 05/15/48 1,500.00 105.90 4.150% 3.7859% Senior Notes 07/31/51 500.00 90.85 2.700% 3.1902% Senior Notes 11/30/52 300.00 102.45 4.100% 3.9594% Totals 8,800.00 or or 8.800 0.00
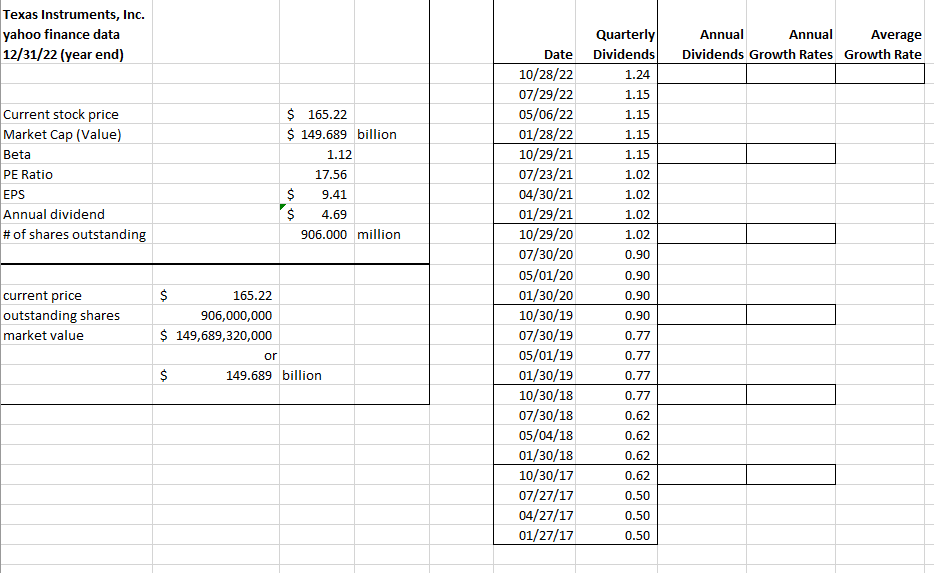
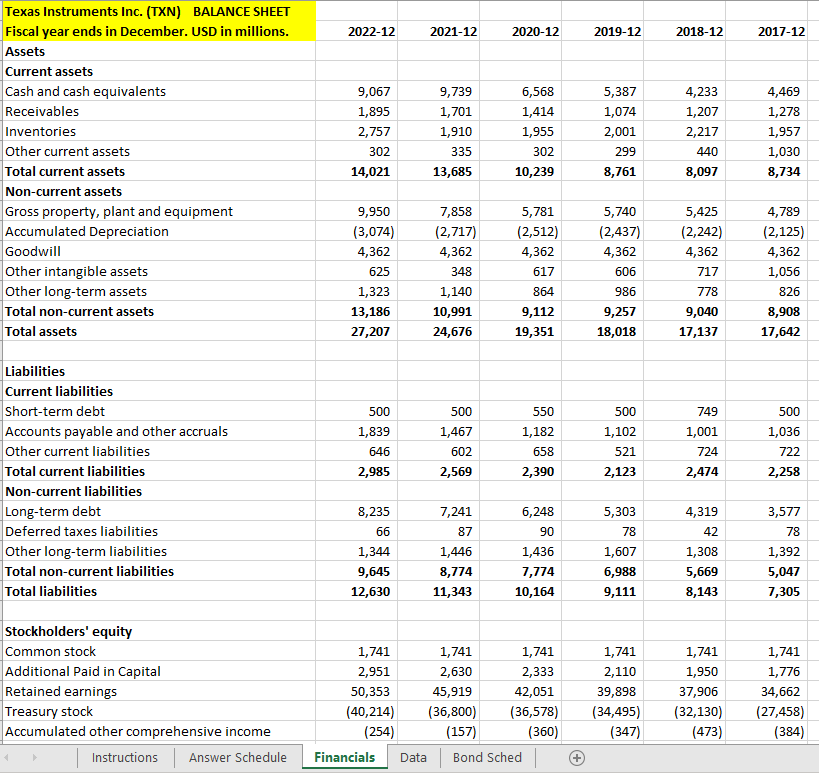
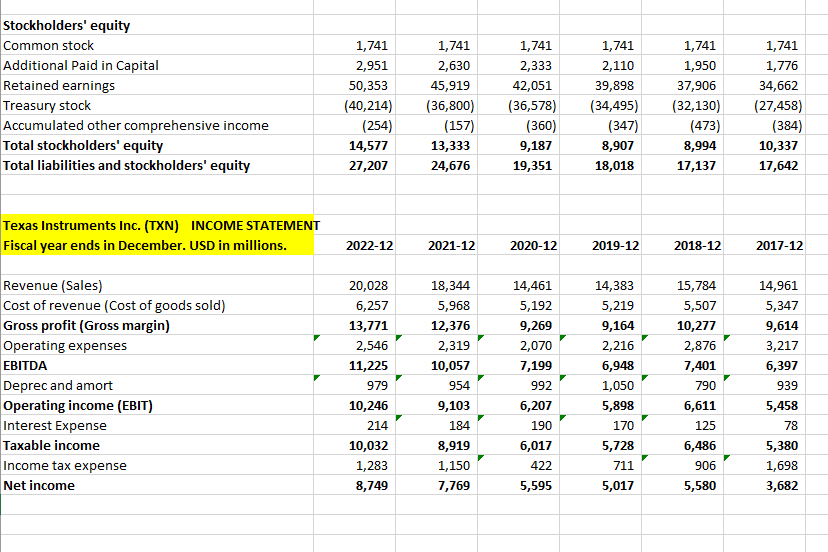
Excel Case \#2 - Texas Instruments, Inc. Answer Schedule Format Total points \begin{tabular}{|r|r|r|r|r|} \hline Date & QuarterlyDividends & AnnualDividendsGrowthRates & rAnderageGrowthRate \\ \hline 10/28/22 & 1.24 & & & \\ \hline 07/29/22 & 1.15 & & & \\ \hline 05/06/22 & 1.15 & & \\ \hline 01/28/22 & 1.15 & & \\ \hline 10/29/21 & 1.15 & & \\ \hline 07/23/21 & 1.02 & & \\ \hline 04/30/21 & 1.02 & & \\ \hline 01/29/21 & 1.02 & & \\ \hline 10/29/20 & 1.02 & & \\ \hline 07/30/20 & 0.90 & & \\ \hline 05/01/20 & 0.90 & & \\ \hline 01/30/20 & 0.90 & & \\ \hline 10/30/19 & 0.90 & & \\ \hline 07/30/19 & 0.77 & & \\ \hline 05/01/19 & 0.77 & & \\ \hline 01/30/19 & 0.77 & & \\ \hline 10/30/18 & 0.77 & & \\ \hline 07/30/18 & 0.62 & & \\ \hline 05/04/18 & 0.62 & & \\ \hline 01/30/18 & 0.62 & & \\ \hline 10/30/17 & 0.62 & & \\ \hline 07/27/17 & 0.50 & & \\ \hline 04/27/17 & 0.50 & & \\ \hline 01/27/17 & 0.50 & & \\ \hline \end{tabular} Face amounts are in millions. Adjustment for tax rate After tax Cost of Debt Texas Instruments Inc. (TXN) BALANCE SHEET \begin{tabular}{|l|r|r|r|r|r|} \hline Fiscal year ends in December. USD in millions. 202212 & 202112 & 202012 & 201912 & 201812 & 2017 \\ \hline Assets & 2012 & 2 \end{tabular} Assets Current assets Cash and cash equivalents Receivables Inventories Other current assets Total current assets \begin{tabular}{|r|r|r|r|r|r|} \hline 9,067 & 9,739 & 6,568 & 5,387 & 4,233 & 4,469 \\ \hline 1,895 & 1,701 & 1,414 & 1,074 & 1,207 & 1,278 \\ \hline 2,757 & 1,910 & 1,955 & 2,001 & 2,217 & 1,957 \\ \hline 14,021 & 13,685 & 10,239 & 8,761 & 8,097 & 8,734 \\ \hline \end{tabular} Non-current assets Gross property, plant and equipment Accumulated Depreciation Goodwill Other intangible assets Other long-term assets Total non-current assets Total assets \begin{tabular}{|r|r|r|r|r|r|} \hline 9,950 & 7,858 & 5,781 & 5,740 & 5,425 & 4,789 \\ \hline(3,074) & (2,717) & (2,512) & (2,437) & (2,242) & (2,125) \\ \hline 4,362 & 4,362 & 4,362 & 4,362 & 4,362 & 4,362 \\ \hline 625 & 348 & 617 & 606 & 717 & 1,056 \\ \hline 1,323 & 1,140 & 864 & 986 & 778 & 826 \\ \hline 13,186 & 10,991 & 9,112 & 9,257 & 9,040 & 8,908 \\ \hline 27,207 & 24,676 & 19,351 & 18,018 & 17,137 & 17,642 \\ \hline \end{tabular} Liabilities Current liabilities Short-term debt Accounts payable and other accruals Other current liabilities Total current liabilities \begin{tabular}{|r|r|r|r|r|r|} \hline 500 & 500 & 550 & 500 & 749 & 500 \\ \hline 1,839 & 1,467 & 1,182 & 1,102 & 1,001 & 1,036 \\ \hline 646 & 602 & 658 & 521 & 724 & 722 \\ \hline 2,985 & 2,569 & 2,390 & 2,123 & 2,474 & 2,258 \\ \hline \end{tabular} Non-current liabilities Long-term debt Deferred taxes liabilities Other long-term liabilities Total non-current liabilities Total liabilities \begin{tabular}{|r|r|r|r|r|r|} \hline 8,235 & 7,241 & 6,248 & 5,303 & 4,319 & 3,577 \\ \hline 66 & 87 & 90 & 78 & 42 & 78 \\ \hline 1,344 & 1,446 & 1,436 & 1,607 & 1,308 & 1,392 \\ \hline 9,645 & 8,774 & 7,774 & 6,988 & 5,669 & 5,047 \\ \hline & 11,343 & 10,164 & 9,111 & 8,143 & 7,305 \\ \hline \end{tabular} Stockholders' equity Common stock Additional Paid in Capital Retained earnings Treasury stock Accumulated other comprehensive income Stockholders' equity Common stock Additional Paid in Capital Retained earnings Treasury stock Accumulated other comprehensive income Total stockholders' equity Total liabilities and stockholders' equity \begin{tabular}{|r|r|r|r|r|r|} \hline 1,741 & 1,741 & 1,741 & 1,741 & 1,741 & 1,741 \\ \hline 2,951 & 2,630 & 2,333 & 2,110 & 1,950 & 1,776 \\ \hline 50,353 & 45,919 & 42,051 & 39,898 & 37,906 & 34,662 \\ \hline(40,214) & (36,800) & (36,578) & (34,495) & (32,130) & (27,458) \\ \hline(254) & (157) & (360) & (347) & (473) & (384) \\ \hline 14,577 & 13,333 & 9,187 & 8,907 & 8,994 & 10,337 \\ \hline 27,207 & 24,676 & 19,351 & 18,018 & 17,137 & 17,642 \\ \hline \end{tabular} Texas Instruments Inc. (TXN) INCOME STATEMENT Fiscal year ends ir Revenue (Sales) Cost of revenue (Cost of goods sold) Gross profit (Gross margin) Operating expenses EBITDA Deprec and amort Operating income (EBIT) Interest Expense Taxable income Income tax expense Net income \begin{tabular}{|r|r|r|r|r|r|} \hline 202212 & 202112 & 202012 & 201912 & 201812 & 201712 \\ \hline 20,028 & 18,344 & 14,461 & 14,383 & 15,784 & 14,961 \\ \hline 6,257 & 5,968 & 5,192 & 5,219 & 5,507 & 5,347 \\ \hline 13,771 & 12,376 & 9,269 & 9,164 & 10,277 & 9,614 \\ \hline 2,546 & 2,319 & 2,070 & 2,216 & 2,876 & 3,217 \\ \hline 11,225 & 10,057 & 7,199 & 6,948 & 7,401 & 6,397 \\ \hline 979 & 954 & 992 & 1,050 & 790 & 939 \\ \hline 10,246 & 9,103 & 6,207 & 5,898 & 6,611 & 5,458 \\ \hline 214 & 184 & 190 & 170 & 125 & 78 \\ \hline 10,032 & 8,919 & 6,017 & 5,728 & 6,486 & 5,380 \\ \hline 1,283 & 1,150 & 422 & 711 & 906 & 1,698 \\ \hline 8,749 & 7,769 & 5,595 & 5,017 & 5,580 & 3,682 \\ \hline \end{tabular} \begin{tabular}{|r|r|r|r|r|} \hline Date & QuarterlyDividends & AnnualDividendsGrowthRates & rAnderageGrowthRate \\ \hline 10/28/22 & 1.24 & & & \\ \hline 07/29/22 & 1.15 & & & \\ \hline 05/06/22 & 1.15 & & \\ \hline 01/28/22 & 1.15 & & \\ \hline 10/29/21 & 1.15 & & \\ \hline 07/23/21 & 1.02 & & \\ \hline 04/30/21 & 1.02 & & \\ \hline 01/29/21 & 1.02 & & \\ \hline 10/29/20 & 1.02 & & \\ \hline 07/30/20 & 0.90 & & \\ \hline 05/01/20 & 0.90 & & \\ \hline 01/30/20 & 0.90 & & \\ \hline 10/30/19 & 0.90 & & \\ \hline 07/30/19 & 0.77 & & \\ \hline 05/01/19 & 0.77 & & \\ \hline 01/30/19 & 0.77 & & \\ \hline 10/30/18 & 0.77 & & \\ \hline 07/30/18 & 0.62 & & \\ \hline 05/04/18 & 0.62 & & \\ \hline 01/30/18 & 0.62 & & \\ \hline 10/30/17 & 0.62 & & \\ \hline 07/27/17 & 0.50 & & \\ \hline 04/27/17 & 0.50 & & \\ \hline 01/27/17 & 0.50 & & \\ \hline \end{tabular} Excel Case \#2 - Texas Instruments, Inc. Answer Schedule Format Total points \begin{tabular}{|r|r|r|r|r|} \hline Date & QuarterlyDividends & AnnualDividendsGrowthRates & rAnderageGrowthRate \\ \hline 10/28/22 & 1.24 & & & \\ \hline 07/29/22 & 1.15 & & & \\ \hline 05/06/22 & 1.15 & & \\ \hline 01/28/22 & 1.15 & & \\ \hline 10/29/21 & 1.15 & & \\ \hline 07/23/21 & 1.02 & & \\ \hline 04/30/21 & 1.02 & & \\ \hline 01/29/21 & 1.02 & & \\ \hline 10/29/20 & 1.02 & & \\ \hline 07/30/20 & 0.90 & & \\ \hline 05/01/20 & 0.90 & & \\ \hline 01/30/20 & 0.90 & & \\ \hline 10/30/19 & 0.90 & & \\ \hline 07/30/19 & 0.77 & & \\ \hline 05/01/19 & 0.77 & & \\ \hline 01/30/19 & 0.77 & & \\ \hline 10/30/18 & 0.77 & & \\ \hline 07/30/18 & 0.62 & & \\ \hline 05/04/18 & 0.62 & & \\ \hline 01/30/18 & 0.62 & & \\ \hline 10/30/17 & 0.62 & & \\ \hline 07/27/17 & 0.50 & & \\ \hline 04/27/17 & 0.50 & & \\ \hline 01/27/17 & 0.50 & & \\ \hline \end{tabular} Face amounts are in millions. Adjustment for tax rate After tax Cost of Debt Texas Instruments Inc. (TXN) BALANCE SHEET \begin{tabular}{|l|r|r|r|r|r|} \hline Fiscal year ends in December. USD in millions. 202212 & 202112 & 202012 & 201912 & 201812 & 2017 \\ \hline Assets & 2012 & 2 \end{tabular} Assets Current assets Cash and cash equivalents Receivables Inventories Other current assets Total current assets \begin{tabular}{|r|r|r|r|r|r|} \hline 9,067 & 9,739 & 6,568 & 5,387 & 4,233 & 4,469 \\ \hline 1,895 & 1,701 & 1,414 & 1,074 & 1,207 & 1,278 \\ \hline 2,757 & 1,910 & 1,955 & 2,001 & 2,217 & 1,957 \\ \hline 14,021 & 13,685 & 10,239 & 8,761 & 8,097 & 8,734 \\ \hline \end{tabular} Non-current assets Gross property, plant and equipment Accumulated Depreciation Goodwill Other intangible assets Other long-term assets Total non-current assets Total assets \begin{tabular}{|r|r|r|r|r|r|} \hline 9,950 & 7,858 & 5,781 & 5,740 & 5,425 & 4,789 \\ \hline(3,074) & (2,717) & (2,512) & (2,437) & (2,242) & (2,125) \\ \hline 4,362 & 4,362 & 4,362 & 4,362 & 4,362 & 4,362 \\ \hline 625 & 348 & 617 & 606 & 717 & 1,056 \\ \hline 1,323 & 1,140 & 864 & 986 & 778 & 826 \\ \hline 13,186 & 10,991 & 9,112 & 9,257 & 9,040 & 8,908 \\ \hline 27,207 & 24,676 & 19,351 & 18,018 & 17,137 & 17,642 \\ \hline \end{tabular} Liabilities Current liabilities Short-term debt Accounts payable and other accruals Other current liabilities Total current liabilities \begin{tabular}{|r|r|r|r|r|r|} \hline 500 & 500 & 550 & 500 & 749 & 500 \\ \hline 1,839 & 1,467 & 1,182 & 1,102 & 1,001 & 1,036 \\ \hline 646 & 602 & 658 & 521 & 724 & 722 \\ \hline 2,985 & 2,569 & 2,390 & 2,123 & 2,474 & 2,258 \\ \hline \end{tabular} Non-current liabilities Long-term debt Deferred taxes liabilities Other long-term liabilities Total non-current liabilities Total liabilities \begin{tabular}{|r|r|r|r|r|r|} \hline 8,235 & 7,241 & 6,248 & 5,303 & 4,319 & 3,577 \\ \hline 66 & 87 & 90 & 78 & 42 & 78 \\ \hline 1,344 & 1,446 & 1,436 & 1,607 & 1,308 & 1,392 \\ \hline 9,645 & 8,774 & 7,774 & 6,988 & 5,669 & 5,047 \\ \hline & 11,343 & 10,164 & 9,111 & 8,143 & 7,305 \\ \hline \end{tabular} Stockholders' equity Common stock Additional Paid in Capital Retained earnings Treasury stock Accumulated other comprehensive income Stockholders' equity Common stock Additional Paid in Capital Retained earnings Treasury stock Accumulated other comprehensive income Total stockholders' equity Total liabilities and stockholders' equity \begin{tabular}{|r|r|r|r|r|r|} \hline 1,741 & 1,741 & 1,741 & 1,741 & 1,741 & 1,741 \\ \hline 2,951 & 2,630 & 2,333 & 2,110 & 1,950 & 1,776 \\ \hline 50,353 & 45,919 & 42,051 & 39,898 & 37,906 & 34,662 \\ \hline(40,214) & (36,800) & (36,578) & (34,495) & (32,130) & (27,458) \\ \hline(254) & (157) & (360) & (347) & (473) & (384) \\ \hline 14,577 & 13,333 & 9,187 & 8,907 & 8,994 & 10,337 \\ \hline 27,207 & 24,676 & 19,351 & 18,018 & 17,137 & 17,642 \\ \hline \end{tabular} Texas Instruments Inc. (TXN) INCOME STATEMENT Fiscal year ends ir Revenue (Sales) Cost of revenue (Cost of goods sold) Gross profit (Gross margin) Operating expenses EBITDA Deprec and amort Operating income (EBIT) Interest Expense Taxable income Income tax expense Net income \begin{tabular}{|r|r|r|r|r|r|} \hline 202212 & 202112 & 202012 & 201912 & 201812 & 201712 \\ \hline 20,028 & 18,344 & 14,461 & 14,383 & 15,784 & 14,961 \\ \hline 6,257 & 5,968 & 5,192 & 5,219 & 5,507 & 5,347 \\ \hline 13,771 & 12,376 & 9,269 & 9,164 & 10,277 & 9,614 \\ \hline 2,546 & 2,319 & 2,070 & 2,216 & 2,876 & 3,217 \\ \hline 11,225 & 10,057 & 7,199 & 6,948 & 7,401 & 6,397 \\ \hline 979 & 954 & 992 & 1,050 & 790 & 939 \\ \hline 10,246 & 9,103 & 6,207 & 5,898 & 6,611 & 5,458 \\ \hline 214 & 184 & 190 & 170 & 125 & 78 \\ \hline 10,032 & 8,919 & 6,017 & 5,728 & 6,486 & 5,380 \\ \hline 1,283 & 1,150 & 422 & 711 & 906 & 1,698 \\ \hline 8,749 & 7,769 & 5,595 & 5,017 & 5,580 & 3,682 \\ \hline \end{tabular} \begin{tabular}{|r|r|r|r|r|} \hline Date & QuarterlyDividends & AnnualDividendsGrowthRates & rAnderageGrowthRate \\ \hline 10/28/22 & 1.24 & & & \\ \hline 07/29/22 & 1.15 & & & \\ \hline 05/06/22 & 1.15 & & \\ \hline 01/28/22 & 1.15 & & \\ \hline 10/29/21 & 1.15 & & \\ \hline 07/23/21 & 1.02 & & \\ \hline 04/30/21 & 1.02 & & \\ \hline 01/29/21 & 1.02 & & \\ \hline 10/29/20 & 1.02 & & \\ \hline 07/30/20 & 0.90 & & \\ \hline 05/01/20 & 0.90 & & \\ \hline 01/30/20 & 0.90 & & \\ \hline 10/30/19 & 0.90 & & \\ \hline 07/30/19 & 0.77 & & \\ \hline 05/01/19 & 0.77 & & \\ \hline 01/30/19 & 0.77 & & \\ \hline 10/30/18 & 0.77 & & \\ \hline 07/30/18 & 0.62 & & \\ \hline 05/04/18 & 0.62 & & \\ \hline 01/30/18 & 0.62 & & \\ \hline 10/30/17 & 0.62 & & \\ \hline 07/27/17 & 0.50 & & \\ \hline 04/27/17 & 0.50 & & \\ \hline 01/27/17 & 0.50 & & \\ \hline \end{tabular}
Step by Step Solution
There are 3 Steps involved in it

Get step-by-step solutions from verified subject matter experts