

Question: Excel Case N2 - Texas Instruments, Inc. Arwer Schedule format Points will be 0.50 175 050 0.se 0.50 we 12/31/21 sata provided on Data tib-sevi
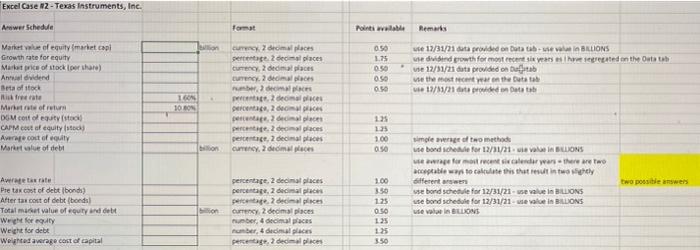
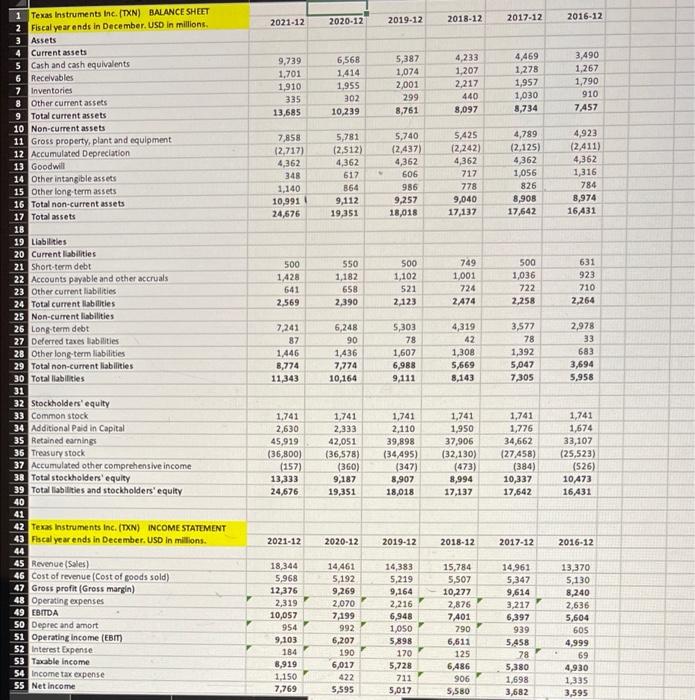
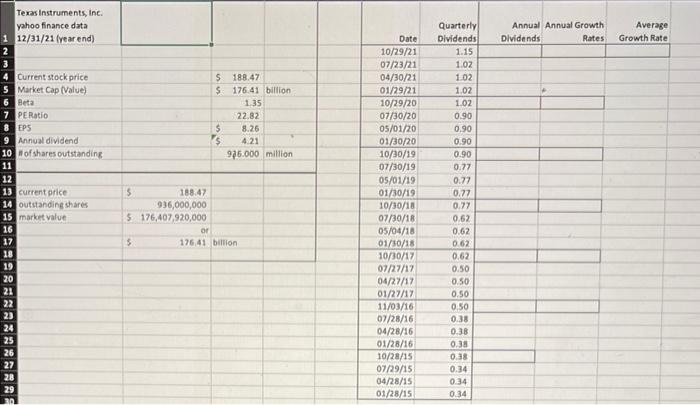
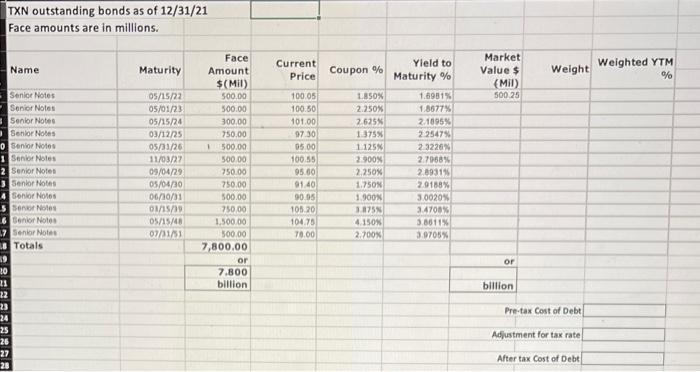
Excel Case N2 - Texas Instruments, Inc. Arwer Schedule format Points will be 0.50 175 050 0.se 0.50 we 12/31/21 sata provided on Data tib-sevi BALIONS we dividend growth for most recent six years sinted on the Ontata se 12/31/21 data provided on talab ve the most recent year on the Dutta 17/11/21 lata redon Data Markete of equitymarket capi Growth rate for equity Market price of stock oerhar) An dividend Bet of stock til fredate Market of return DOM coolutista CAPM cost of equity isted Average cost of guily Market af of debt TON 10 U doma percentage de places Currency 2 decimal places Currency 2 malce budeme Pompes percentage 2 per les percentage decimal proces percentar 2 decimal places currency empeces 13 135 100 OSO simple of two method se bord de for 12/31/21 i va I BLOONS we wage for most recent calendar years there are two table to calculate this that result in two diferentes vsebord schedule for 12/31/21-use value in BILLIONS use bond schedule for 12/31/21-eva in BILLIONS se van LLONS two possible answers percentape 2 decimal places percenta. 2 decimal places percebe decimal Currency 2 decimal places ruber 4 decimal places ber, aces percentage decimal places Pre tax cost of debt bonds) After tax cost of debt bonds Totalment value of equity and debt Weight for Weight for det Weighted average cost of capital 100 3.50 125 0:50 125 13 3.50 2021-12 2020-12 2019-12 2018-12 2017-12 2016-12 9,739 1,701 1,910 335 13,685 6,568 1.414 1,955 302 10,239 5,387 1,074 2,001 299 8,761 4,233 1,207 2,217 440 8,097 4,469 1,278 1,957 1,030 8,734 3.490 1,267 1,790 910 7457 7,858 (2,717) 4,362 348 1,140 10,991 24,676 5,781 (2,512) 4,362 617 864 9,112 19,351 5,740 (2.437) 4,362 606 986 9,257 18,018 5,425 12,242) 4,362 717 778 9,040 17,137 4,789 (2,125) 4,362 1,056 826 8,908 17,642 4,923 (2.411) 4,362 1,316 784 8,974 16431 500 631 500 1,428 641 2,569 550 1,182 658 2,390 500 1,102 521 2,123 749 1,001 724 2,474 1,036 722 2,258 923 710 2,264 1 Texas Instruments Inc. (TXN) BALANCE SHEET 2 Fiscal year ends in December. USD in millions 3 Assets 4 Current assets 5 Cash and cash equivalents 6 Receivables 7 Inventories 8 Other current assets 9 Total current assets 10 Non-current assets 11 Gross property, plant and equipment 12 Accumulated Depreciation 13 Goodwill 14 Other intangible assets 15 Other long-term assets 16 Total non-current assets 17 Total assets 18 19 Liabilities 20 Current liabilities 21 Short-term debt 22 Accounts payable and other accruals 23 Other current liabilities 24 Total current abilities 25 Non-current liabilities 26 Long-term debt 27 Deferred taxes abilities 28 Other long-term liabilities 29 Total non-current liabilities 30 Total abilities 31 32 Stockholders'equity 33 Common stock 34 Additional Paid in Capital 35 Retained earnings 36 Treasury stock 37 Accumulated other comprehensive income 38 Total stockholders'equity 39 Total liabilities and stockholders' equity 40 41 42 Texas Instruments Inc. (TXN) INCOME STATEMENT 43 Fiscal year ends in December. USD in millions. 44 45 Revenue (Sales) 46 cost of revenue (Cost of goods sold) 47 Gross profit (Gross margin) 48 Operating expenses 49 EBITDA SO Deprecand amort 51 Operating income (EBM 52 Interest Expense 53 Taxable income 54 Income tax expense 55 Net Income 7,241 87 1.446 8,774 11,343 6,248 90 1,436 7,774 10,164 5,303 78 1,607 6,988 9,111 4,319 42 1,308 5,669 8,143 3,577 78 1,392 5,047 7,305 2,978 33 683 3,694 5,958 1.741 2,630 45,919 (36,800) (157) 13,333 24,676 1,741 2,333 42,051 (36,578) (360) 9,187 19,351 1,741 2,110 39,898 (34,495) (347) 8,907 18,018 1,741 1,950 37,906 (32,130) (473) 8,994 17,137 1,741 1,776 34,662 (27458) (384) 10,337 17,642 1,741 1,674 33,107 (25,523) (526) 10473 16,431 2021-12 2020-12 2019-12 2018-12 2017-12 2016-12 18,344 5,968 12,376 2,319 10,057 954 9,103 184 8,919 1.150 7,769 14461 5,192 9,269 2.070 7,199 992 6,207 190 6,017 422 5,595 14,383 5,219 9,164 2,216 6,948 1,050 5,898 170 5,728 711 5,017 15,784 5,507 10,277 2.876 7,401 790 6,611 125 6,486 906 5,580 14,961 5,347 9,614 3,217 6,397 939 5.458 78 5,380 1,698 3,682 13,370 5,130 8,240 2,636 5,604 605 4,999 69 4,930 1,335 3,595 Texas Instruments, Inc. yahoo finance data 1 12/31/21 (year end) Annual Annual Growth Dividends Rates Average Growth Rate NM $ $ 188.47 176.41 billion 135 22.82 8.26 4.21 976.000 million Quarterly Dividends 1.15 1.02 102 1.02 1.02 0.90 0.90 0.90 0.90 0.77 0.77 0.77 0.77 0.62 $ $ 4 Current stock price 5 Market Cap (Value) Beta PERatio 8 EPS 9 Annual dividend 10 of shares outstanding 11 12 13 current price 14 outstanding shares 15 market value 16 17 18 19 20 21 22 23 24 25 26 27 28 29 30 Date 10/29/21 07/23/21 04/30/21 01/29/21 10/29/20 07/30/20 05/01/20 01/30/20 10/30/19 07/30/19 05/01/19 01/30/19 10/30/18 07/30/18 05/04/18 01/30/18 10/30/17 07/27/17 04/27/17 01/27/17 11/03/16 07/28/16 04/28/16 01/28/16 10/28/15 07/29/15 04/28/15 01/28/15 $ 188.47 936,000,000 5 176,407,920,000 or $ 176 41 billion 0.62 0.62 0.50 0.50 0.50 0.50 0.38 0.38 0.38 0.38 0.34 0.34 0.34 TXN outstanding bonds as of 12/31/21 Face amounts are in millions. Name Maturity Current Price Coupon % Yield to Maturity % Market Value $ (MI) 500.25 Weighted YTM Weight % Senior Notes Senior Notes Senior Notes Senior Notes 0 Senior Notes 1 Senior Notes 2 Senior Notes 3 Senior Notes 4 Senior Notes 5 Sono Notes 6 Senior Notes 7 Senior Notes 8 Totals 39 20 11 22 23 24 25 26 27 23 05/15/22 05/01/23 05/15/24 03/12/25 05/31/26 11/03/27 09/0429 05/04/30 06/10/31 01/15/39 05/15/08 07/01/51 Face Amount $(MI) 500.00 500.00 300.00 750.00 1 500.00 500.00 750.00 750.00 500.00 750.00 1.500.00 500.00 7,800.00 or 7.800 billion 100.05 100.50 101.00 97 30 05.00 100.55 95.60 01.40 90.95 105.20 104.75 70.00 LSOX 2.250% 2625 1375% 1125% 2.900% 2.250% 1.750N 1.900N 3.875 4130N 2.700% 1.6931% 1.8677% 2.1895% 225475 23226 2.7989 28931% 20168% 3.0020 3.4700 3.8611% 3.9705% or billion Pre-tax cost of Debt Adjustment for tax rate After tax Cost of Debt Excel Case N2 - Texas Instruments, Inc. Arwer Schedule format Points will be 0.50 175 050 0.se 0.50 we 12/31/21 sata provided on Data tib-sevi BALIONS we dividend growth for most recent six years sinted on the Ontata se 12/31/21 data provided on talab ve the most recent year on the Dutta 17/11/21 lata redon Data Markete of equitymarket capi Growth rate for equity Market price of stock oerhar) An dividend Bet of stock til fredate Market of return DOM coolutista CAPM cost of equity isted Average cost of guily Market af of debt TON 10 U doma percentage de places Currency 2 decimal places Currency 2 malce budeme Pompes percentage 2 per les percentage decimal proces percentar 2 decimal places currency empeces 13 135 100 OSO simple of two method se bord de for 12/31/21 i va I BLOONS we wage for most recent calendar years there are two table to calculate this that result in two diferentes vsebord schedule for 12/31/21-use value in BILLIONS use bond schedule for 12/31/21-eva in BILLIONS se van LLONS two possible answers percentape 2 decimal places percenta. 2 decimal places percebe decimal Currency 2 decimal places ruber 4 decimal places ber, aces percentage decimal places Pre tax cost of debt bonds) After tax cost of debt bonds Totalment value of equity and debt Weight for Weight for det Weighted average cost of capital 100 3.50 125 0:50 125 13 3.50 2021-12 2020-12 2019-12 2018-12 2017-12 2016-12 9,739 1,701 1,910 335 13,685 6,568 1.414 1,955 302 10,239 5,387 1,074 2,001 299 8,761 4,233 1,207 2,217 440 8,097 4,469 1,278 1,957 1,030 8,734 3.490 1,267 1,790 910 7457 7,858 (2,717) 4,362 348 1,140 10,991 24,676 5,781 (2,512) 4,362 617 864 9,112 19,351 5,740 (2.437) 4,362 606 986 9,257 18,018 5,425 12,242) 4,362 717 778 9,040 17,137 4,789 (2,125) 4,362 1,056 826 8,908 17,642 4,923 (2.411) 4,362 1,316 784 8,974 16431 500 631 500 1,428 641 2,569 550 1,182 658 2,390 500 1,102 521 2,123 749 1,001 724 2,474 1,036 722 2,258 923 710 2,264 1 Texas Instruments Inc. (TXN) BALANCE SHEET 2 Fiscal year ends in December. USD in millions 3 Assets 4 Current assets 5 Cash and cash equivalents 6 Receivables 7 Inventories 8 Other current assets 9 Total current assets 10 Non-current assets 11 Gross property, plant and equipment 12 Accumulated Depreciation 13 Goodwill 14 Other intangible assets 15 Other long-term assets 16 Total non-current assets 17 Total assets 18 19 Liabilities 20 Current liabilities 21 Short-term debt 22 Accounts payable and other accruals 23 Other current liabilities 24 Total current abilities 25 Non-current liabilities 26 Long-term debt 27 Deferred taxes abilities 28 Other long-term liabilities 29 Total non-current liabilities 30 Total abilities 31 32 Stockholders'equity 33 Common stock 34 Additional Paid in Capital 35 Retained earnings 36 Treasury stock 37 Accumulated other comprehensive income 38 Total stockholders'equity 39 Total liabilities and stockholders' equity 40 41 42 Texas Instruments Inc. (TXN) INCOME STATEMENT 43 Fiscal year ends in December. USD in millions. 44 45 Revenue (Sales) 46 cost of revenue (Cost of goods sold) 47 Gross profit (Gross margin) 48 Operating expenses 49 EBITDA SO Deprecand amort 51 Operating income (EBM 52 Interest Expense 53 Taxable income 54 Income tax expense 55 Net Income 7,241 87 1.446 8,774 11,343 6,248 90 1,436 7,774 10,164 5,303 78 1,607 6,988 9,111 4,319 42 1,308 5,669 8,143 3,577 78 1,392 5,047 7,305 2,978 33 683 3,694 5,958 1.741 2,630 45,919 (36,800) (157) 13,333 24,676 1,741 2,333 42,051 (36,578) (360) 9,187 19,351 1,741 2,110 39,898 (34,495) (347) 8,907 18,018 1,741 1,950 37,906 (32,130) (473) 8,994 17,137 1,741 1,776 34,662 (27458) (384) 10,337 17,642 1,741 1,674 33,107 (25,523) (526) 10473 16,431 2021-12 2020-12 2019-12 2018-12 2017-12 2016-12 18,344 5,968 12,376 2,319 10,057 954 9,103 184 8,919 1.150 7,769 14461 5,192 9,269 2.070 7,199 992 6,207 190 6,017 422 5,595 14,383 5,219 9,164 2,216 6,948 1,050 5,898 170 5,728 711 5,017 15,784 5,507 10,277 2.876 7,401 790 6,611 125 6,486 906 5,580 14,961 5,347 9,614 3,217 6,397 939 5.458 78 5,380 1,698 3,682 13,370 5,130 8,240 2,636 5,604 605 4,999 69 4,930 1,335 3,595 Texas Instruments, Inc. yahoo finance data 1 12/31/21 (year end) Annual Annual Growth Dividends Rates Average Growth Rate NM $ $ 188.47 176.41 billion 135 22.82 8.26 4.21 976.000 million Quarterly Dividends 1.15 1.02 102 1.02 1.02 0.90 0.90 0.90 0.90 0.77 0.77 0.77 0.77 0.62 $ $ 4 Current stock price 5 Market Cap (Value) Beta PERatio 8 EPS 9 Annual dividend 10 of shares outstanding 11 12 13 current price 14 outstanding shares 15 market value 16 17 18 19 20 21 22 23 24 25 26 27 28 29 30 Date 10/29/21 07/23/21 04/30/21 01/29/21 10/29/20 07/30/20 05/01/20 01/30/20 10/30/19 07/30/19 05/01/19 01/30/19 10/30/18 07/30/18 05/04/18 01/30/18 10/30/17 07/27/17 04/27/17 01/27/17 11/03/16 07/28/16 04/28/16 01/28/16 10/28/15 07/29/15 04/28/15 01/28/15 $ 188.47 936,000,000 5 176,407,920,000 or $ 176 41 billion 0.62 0.62 0.50 0.50 0.50 0.50 0.38 0.38 0.38 0.38 0.34 0.34 0.34 TXN outstanding bonds as of 12/31/21 Face amounts are in millions. Name Maturity Current Price Coupon % Yield to Maturity % Market Value $ (MI) 500.25 Weighted YTM Weight % Senior Notes Senior Notes Senior Notes Senior Notes 0 Senior Notes 1 Senior Notes 2 Senior Notes 3 Senior Notes 4 Senior Notes 5 Sono Notes 6 Senior Notes 7 Senior Notes 8 Totals 39 20 11 22 23 24 25 26 27 23 05/15/22 05/01/23 05/15/24 03/12/25 05/31/26 11/03/27 09/0429 05/04/30 06/10/31 01/15/39 05/15/08 07/01/51 Face Amount $(MI) 500.00 500.00 300.00 750.00 1 500.00 500.00 750.00 750.00 500.00 750.00 1.500.00 500.00 7,800.00 or 7.800 billion 100.05 100.50 101.00 97 30 05.00 100.55 95.60 01.40 90.95 105.20 104.75 70.00 LSOX 2.250% 2625 1375% 1125% 2.900% 2.250% 1.750N 1.900N 3.875 4130N 2.700% 1.6931% 1.8677% 2.1895% 225475 23226 2.7989 28931% 20168% 3.0020 3.4700 3.8611% 3.9705% or billion Pre-tax cost of Debt Adjustment for tax rate After tax Cost of Debt
Step by Step Solution
There are 3 Steps involved in it

Get step-by-step solutions from verified subject matter experts