

Question: Exercise 1 0 . 2 The following table contains the averages of each question of servqual questioner. table [ [ No . ,
Exercise
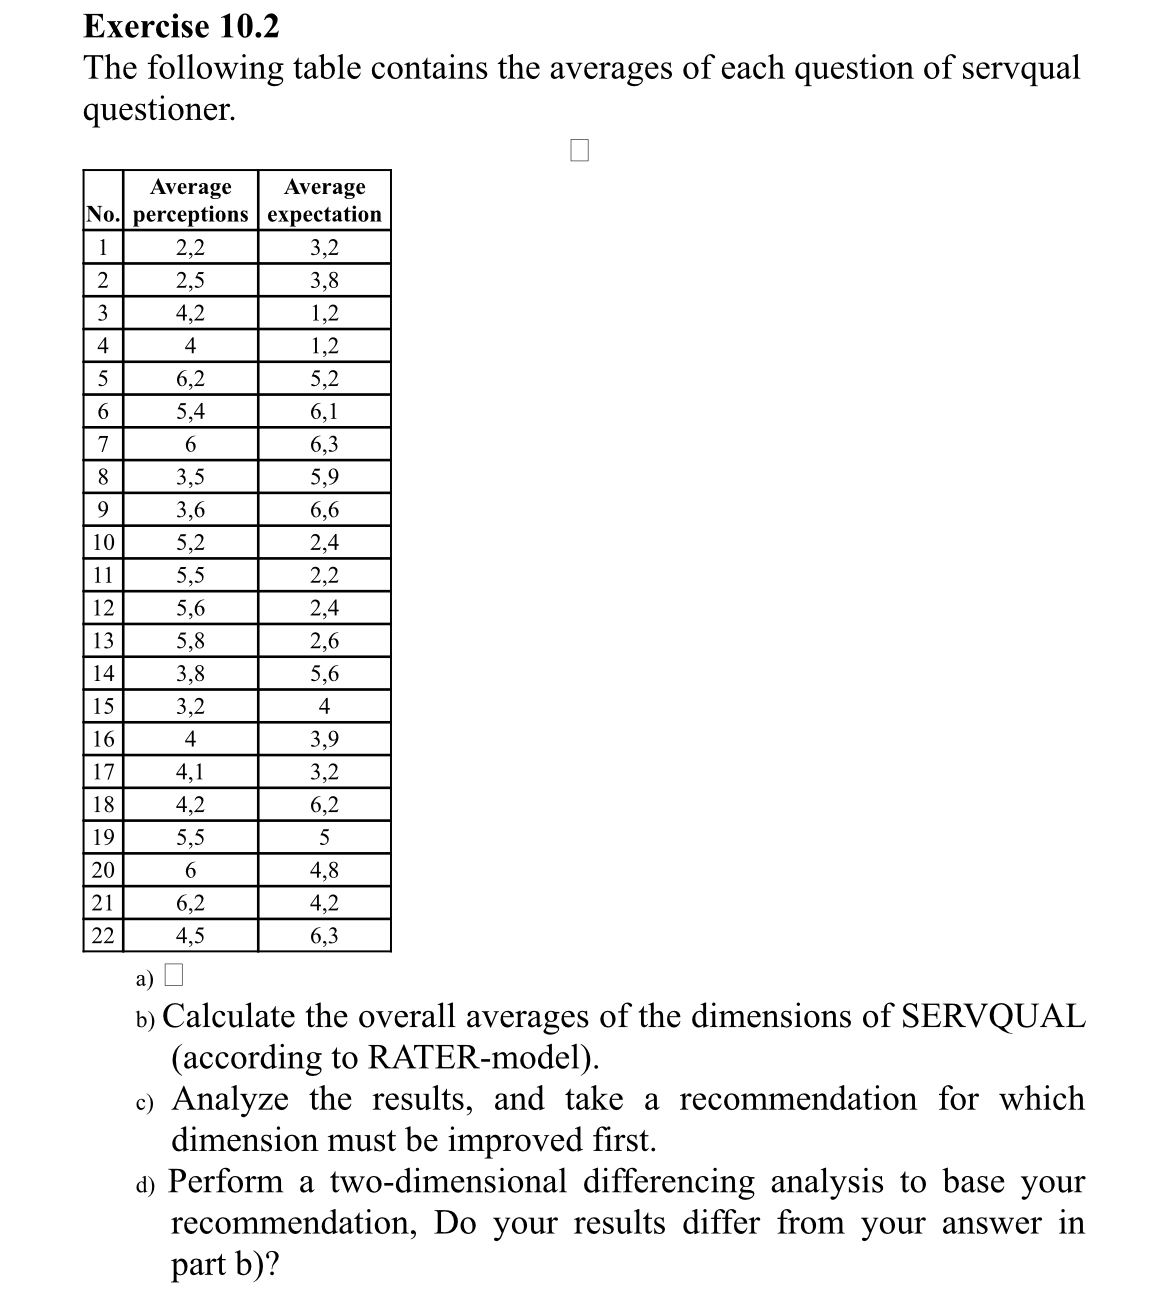
The following table contains the averages of each question of servqual questioner.
tableNotableAverageperceptionstableAverageexpectation
a
b Calculate the overall averages of the dimensions of SERVQUAL according to RATERmodel
c Analyze the results, and take a recommendation for which dimension must be improved first.
d Perform a twodimensional differencing analysis to base your recommendation, Do your results differ from your answer in part b
Please solve this problem with step by step solution so that I can understand it
Step by Step Solution
There are 3 Steps involved in it
1 Expert Approved Answer
Step: 1 Unlock

Question Has Been Solved by an Expert!
Get step-by-step solutions from verified subject matter experts
Step: 2 Unlock
Step: 3 Unlock