

Question: EXERCISE: 1 ) Using the diagram in Figure 1 , study the stability of the closed - loop system where the values ( G
EXERCISE:
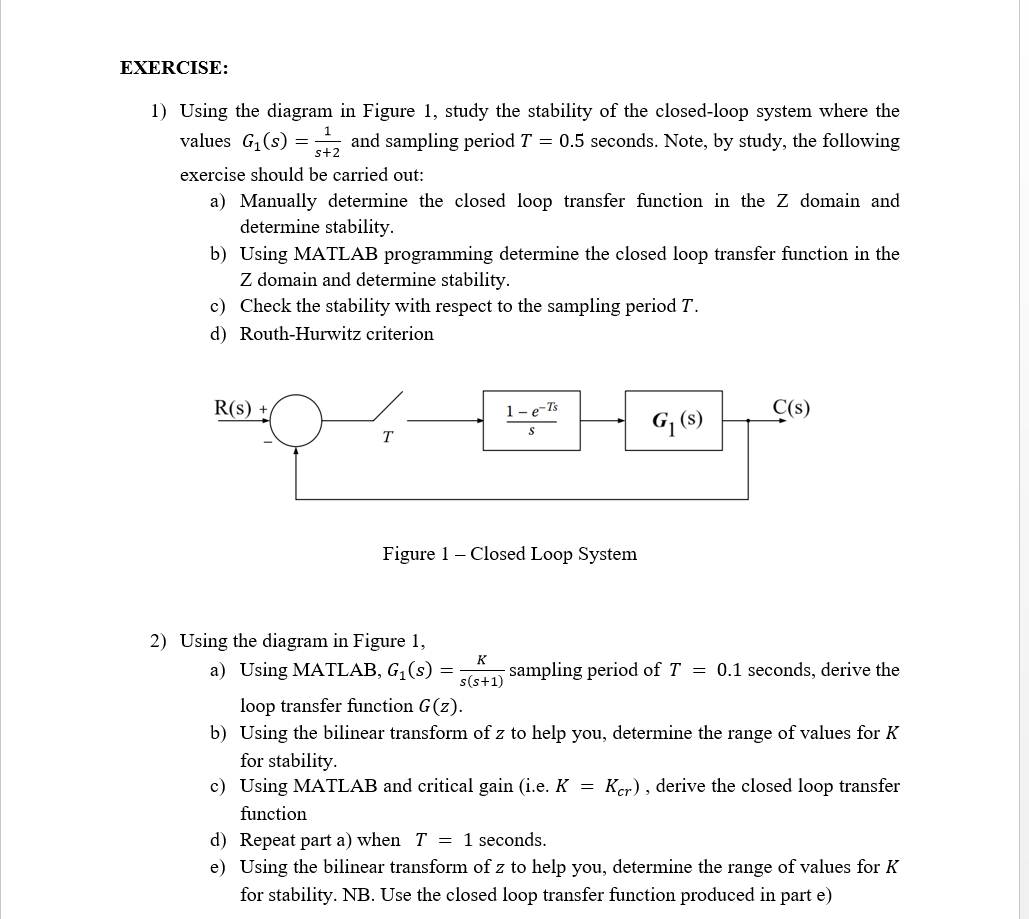
Using the diagram in Figure study the stability of the closedloop system where the values Gsfracs and sampling period T seconds. Note, by study, the following exercise should be carried out:
a Manually determine the closed loop transfer function in the Z domain and determine stability.
b Using MATLAB programming determine the closed loop transfer function in the Z domain and determine stability.
c Check the stability with respect to the sampling period T
d RouthHurwitz criterion
Figure Closed Loop System
Using the diagram in Figure
a Using MATLAB, GsfracKss sampling period of T seconds, derive the loop transfer function Gz
b Using the bilinear transform of z to help you, determine the range of values for K for stability.
c Using MATLAB and critical gain ie KKc r derive the closed loop transfer function
d Repeat part a when T seconds.
e Using the bilinear transform of z to help you, determine the range of values for K for stability. NB Use the closed loop transfer function produced in part e
Step by Step Solution
There are 3 Steps involved in it
1 Expert Approved Answer
Step: 1 Unlock

Question Has Been Solved by an Expert!
Get step-by-step solutions from verified subject matter experts
Step: 2 Unlock
Step: 3 Unlock