

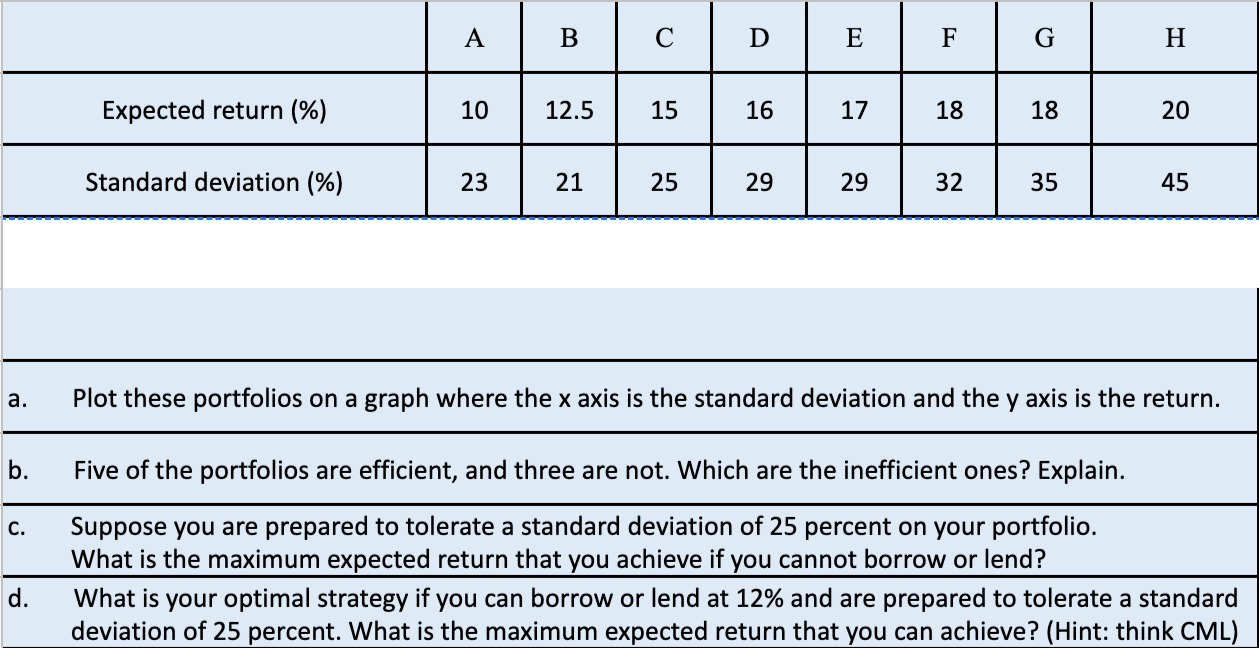
Question: Expected return (%} A B C D E F G H ll anaaaaaul Standard deviation (%) Plot these portfolios on a graph where the x
Step by Step Solution
There are 3 Steps involved in it

Get step-by-step solutions from verified subject matter experts