

Question: Explain the answers in detail 54 Chapter 2 ORGANIZING DATA (i) Sample of size 30 (ii) Sample of size 50 8) 9-- 12 W G)
Explain the answers in detail
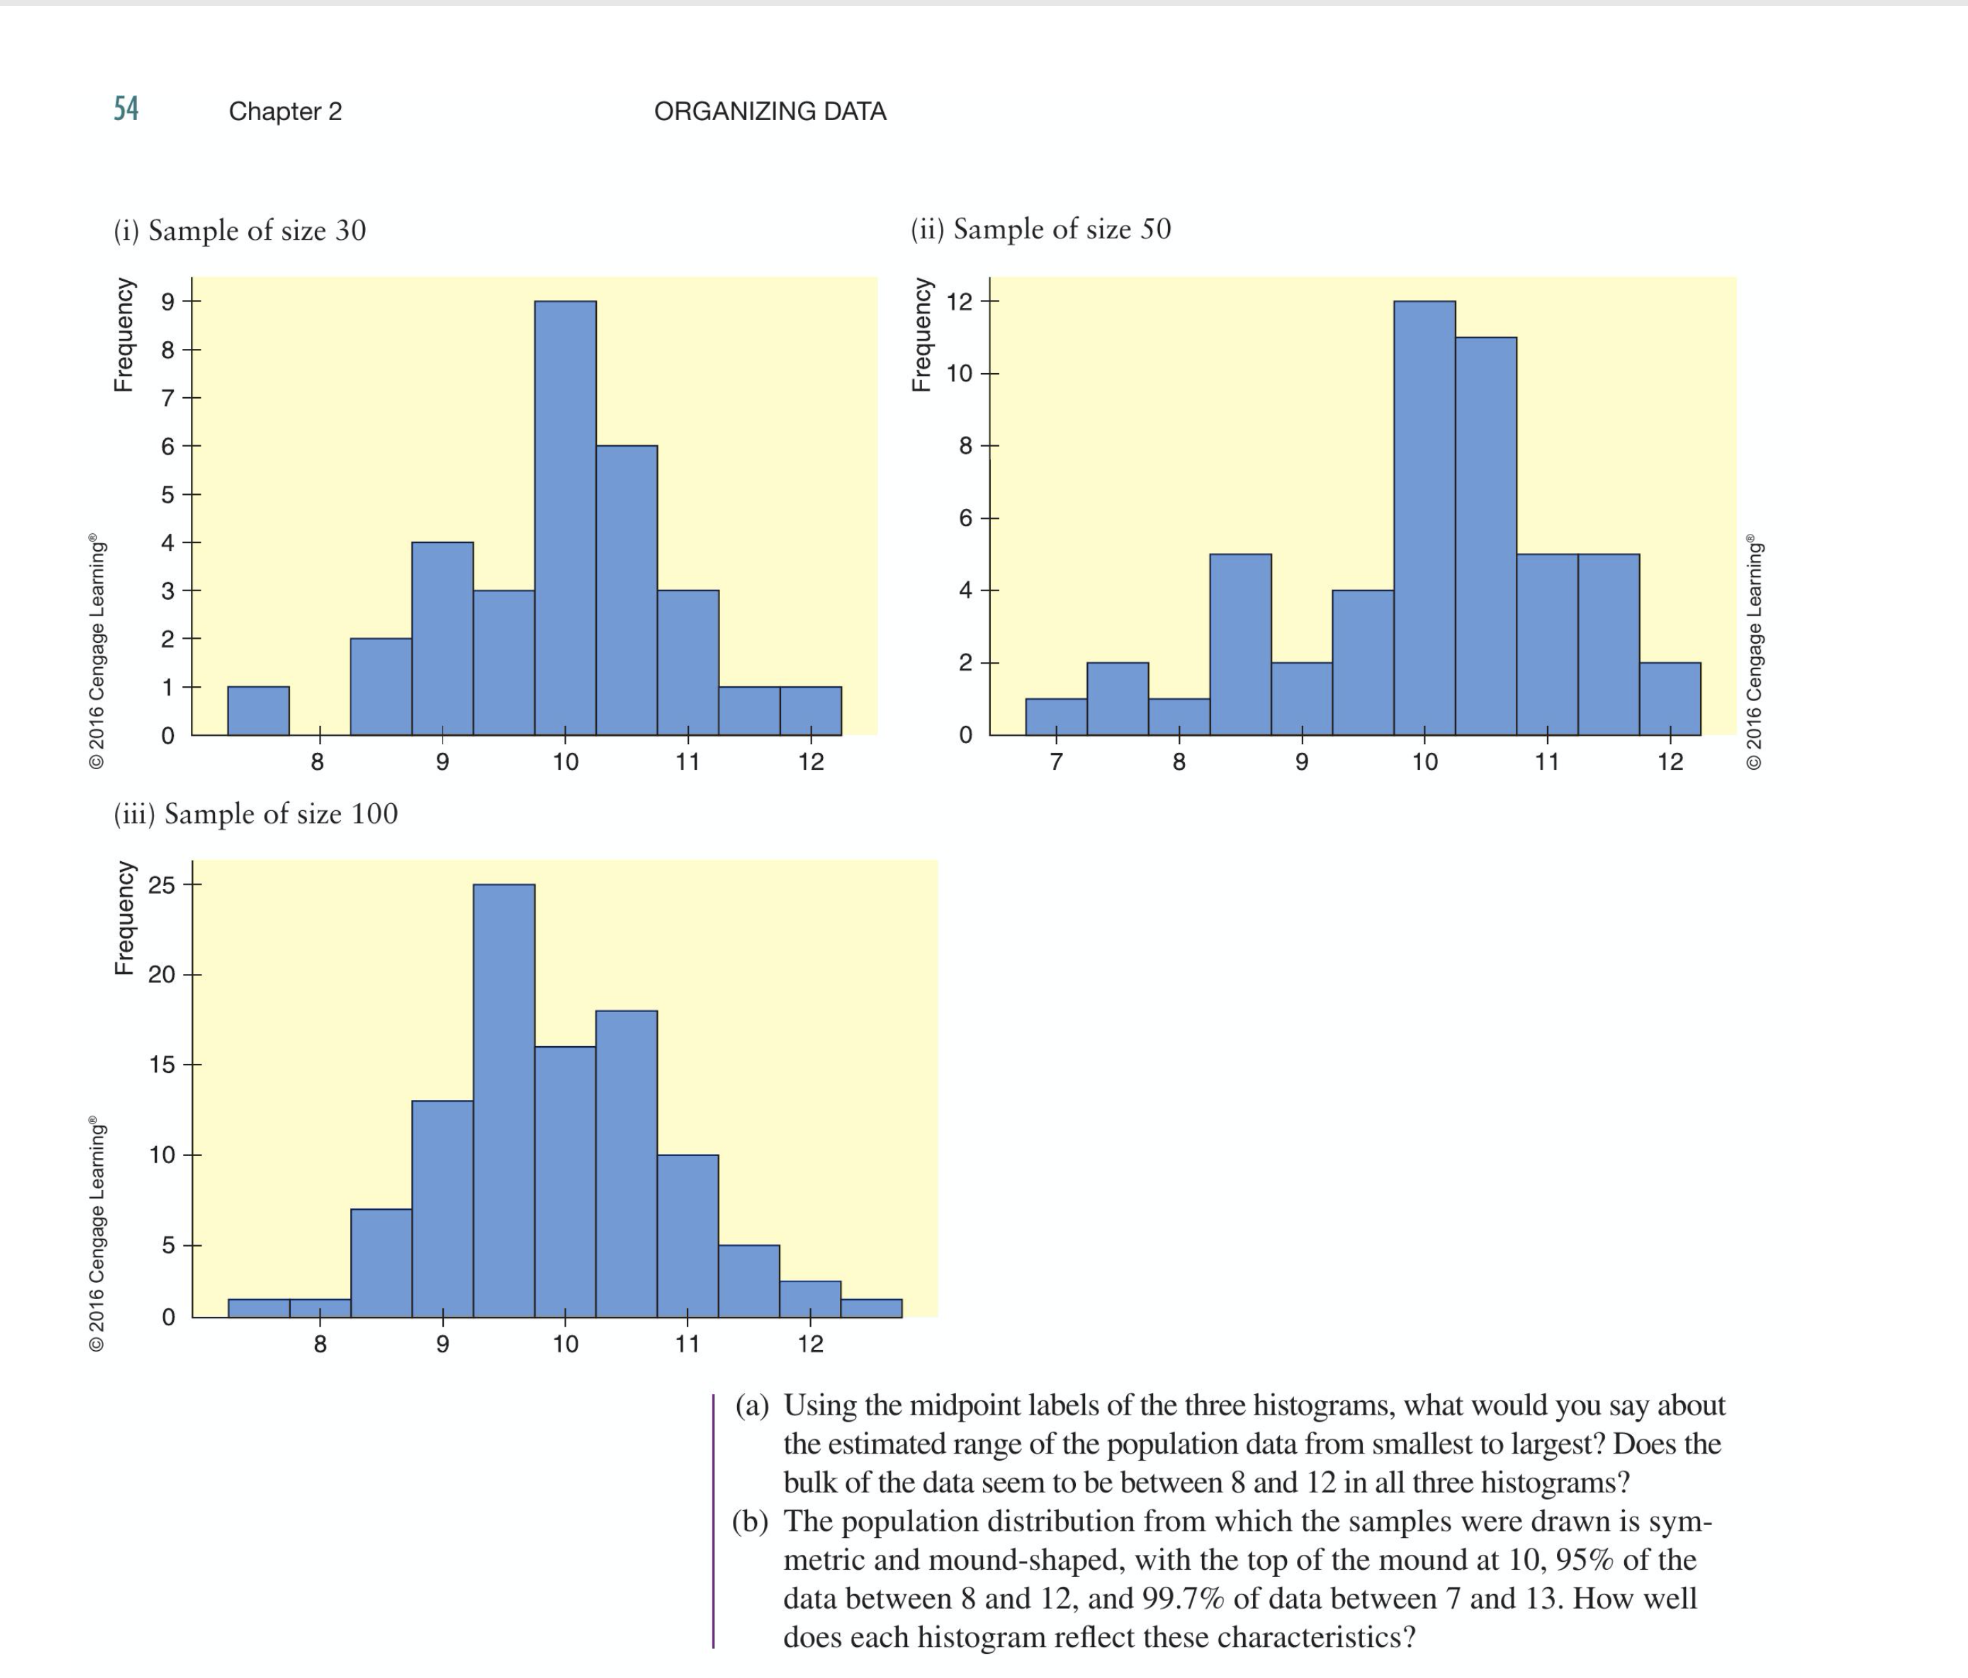
54 Chapter 2 ORGANIZING DATA (i) Sample of size 30 (ii) Sample of size 50 8) 9-- 12 W G) 3 3 D\" 8 -- 0' 2 1' 10 __ u. 7 _ u. 8 _ 6 _ 6 fa.\" i 4 _I 2' 2 __ 8 :9 8 0 (9 8 9 10 11 12 7 (iii) Sample of size 100 Frequency N 01 N O _A. O 0 2016 Cengage Leaming' or 8 9 10 11 12 (a) Using the midpoint labels of the three histograms, what would you say about the estimated range of the population data from smallest to largest? Does the bulk of the data seem to be between 8 and 12 in all three histograms? (b) The population distribution from which the samples were drawn is sym- metric and mound-shaped, with the top of the mound at 10, 95% of the data between 8 and 12, and 99.7% of data between 7 and 13. How well does each histogram reect these characteristics? 2016 Cengaga Learning\
Step by Step Solution
There are 3 Steps involved in it

Get step-by-step solutions from verified subject matter experts