Question: explaine the chart Question -1: Make a histogram in MS Excel using the following data. (10 Marks): 4.7 4.7 5 5.6 5.6 5.6 5.9 5.9

explaine the chart explaine the chart Question -1: Make a histogram
Question -1: Make a histogram in MS Excel using the following data. (10 Marks): 4.7 4.7 5 5.6 5.6 5.6 5.9 5.9 5.9 5.9 6.2 6.2 6.2 6.2 6.2 6.2 6.5 6.5 6.5 6.5 6.5 6.5 6.8 6.8 9.8 9.8 9.8 9.8 6.8 6.8 6.8 6.8 6.8 6.8 6.8 6.8 6.8 6.8 6.8 7.1 7.1 7.1 7.1 7.1 7.1 7.2 7.2 7.2 7.2 7.2 7.2 7.2 7.4 7.4 7.4 7.4 7.5 7.5 7.5 7.5 7.7 7.7 7.7 7.7 7.7 7.7 7.7 7.7 7.7 7.7 7.7 7.7 7.7 7.7 7.7 7.7 7.7 8 8 8 8 8 8.3 8.3 8.3 8.3 8.3 8.3 8.6 8.6 8.6 8.6 8.6 8.6 8.9 8.9 8.9 9.2 9.2 9.8 7.8 7.8 7.8 9.7 9.7 9.7 10 10 10.4 10.4 10.4 10.5 10.5 10.5 10.5 10.5 10.5 10.5 10.6 10.6 10.6 10.6 10.8 10.8 10.8 10.8 10.8 10.8

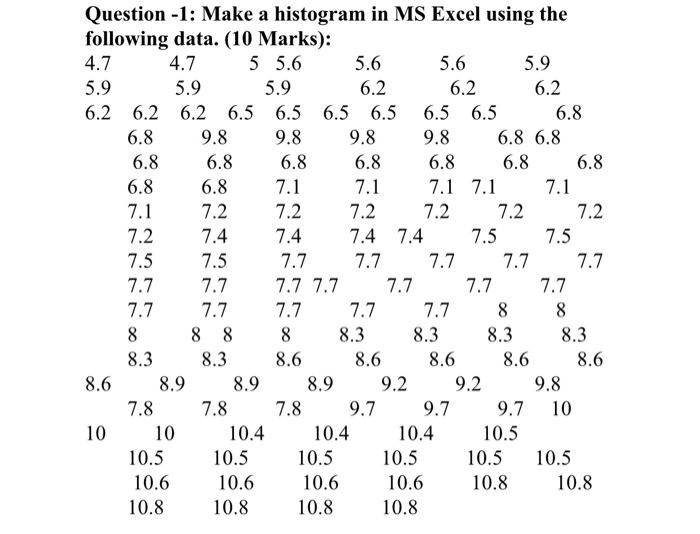
Step by Step Solution

There are 3 Steps involved in it

1 Expert Approved Answer
Step: 1 Unlock blur-text-image
Question Has Been Solved by an Expert!

Get step-by-step solutions from verified subject matter experts

Step: 2 Unlock
Step: 3 Unlock

Students Have Also Explored These Related General Management Questions!