

Question: f- Project 2: Visualize and summarize your data Your proiect task for the week: - Describe the What and the Data source of your data
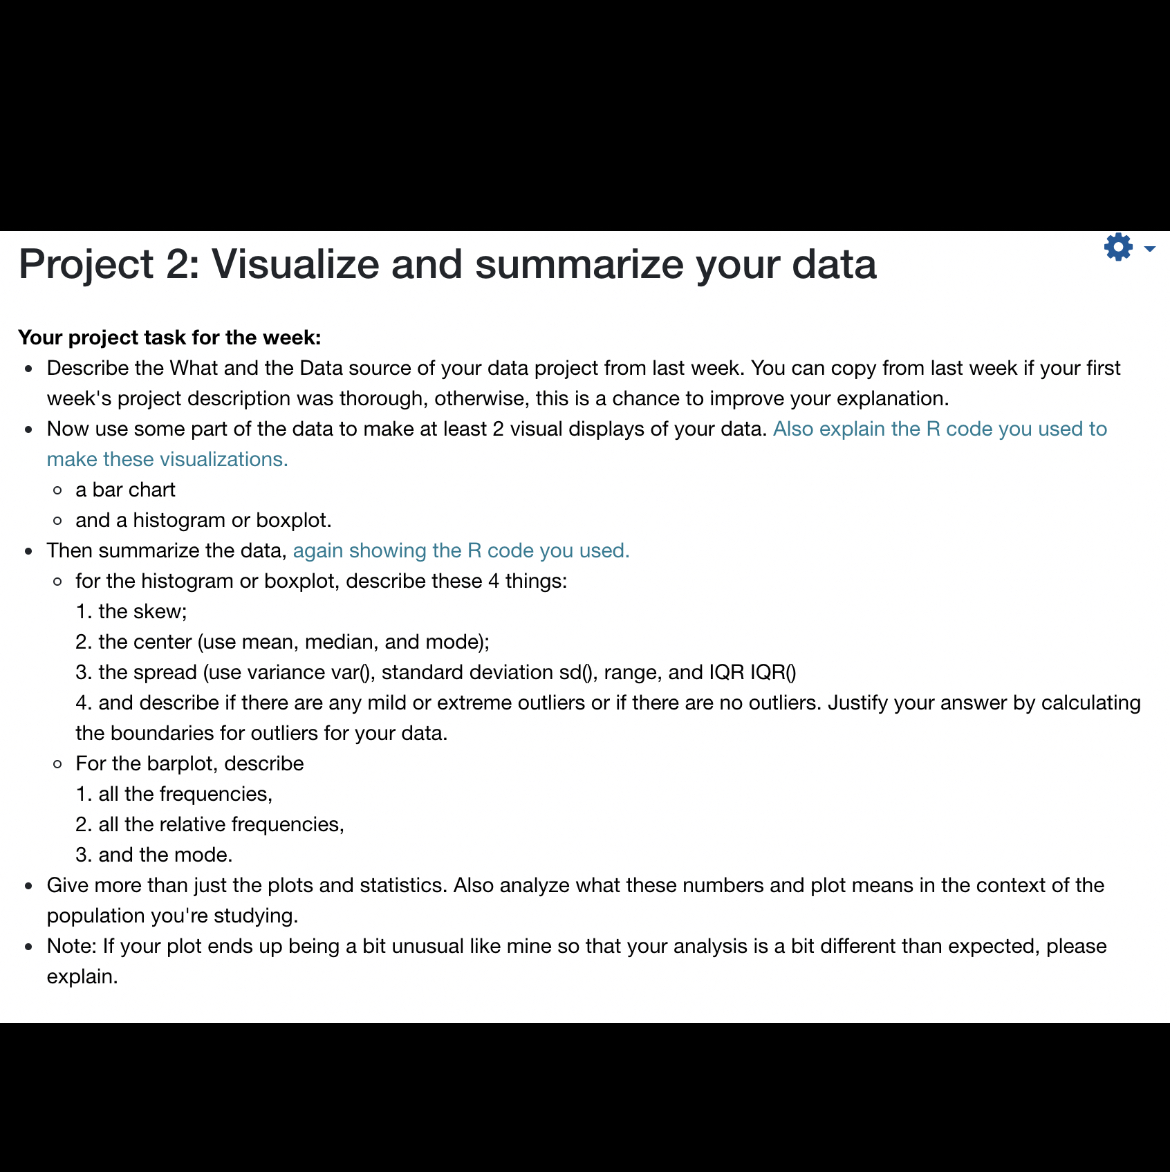
\f- Project 2: Visualize and summarize your data Your proiect task for the week: - Describe the What and the Data source of your data project from last week. You can copy from last week if your first week's project description was thorough, otherwise, this is a chance to improve your explanation. - Now use some part of the data to make at least 2 visual displays of your data. Also explain the R code you used to make these visualizations. o a bar chart 0 and a histogram or boxplot. . Then summarize the data, again showing the Ft code you used. 0 for the histogram or boxplot, describe these 4 things: 1. the skew; 2. the center (use mean, median, and mode); 3. the spread (use variance varo, standard deviation sdo, range, and IQFl IQRO 4. and describe if there are any mild or extreme outliers or if there are no outliers. Justify your answer by calculating the boundaries for outliers for your data. 0 For the barplot, describe 1. all the frequencies, 2. all the relative frequencies, 3. and the mode. 0 Give more than just the plots and statistics. Also analyze what these numbers and plot means in the context of the population you're studying. a Note: If your plot ends up being a bit unusual like mine so that your analysis is a bit different than expected, please explain
Step by Step Solution
There are 3 Steps involved in it

Get step-by-step solutions from verified subject matter experts