

Question: next question prevents changes to this answer. Question 11 Question 11 10 points Save Table 5.1 Factors for Calculating Three-Sigma Limits for the x Chart
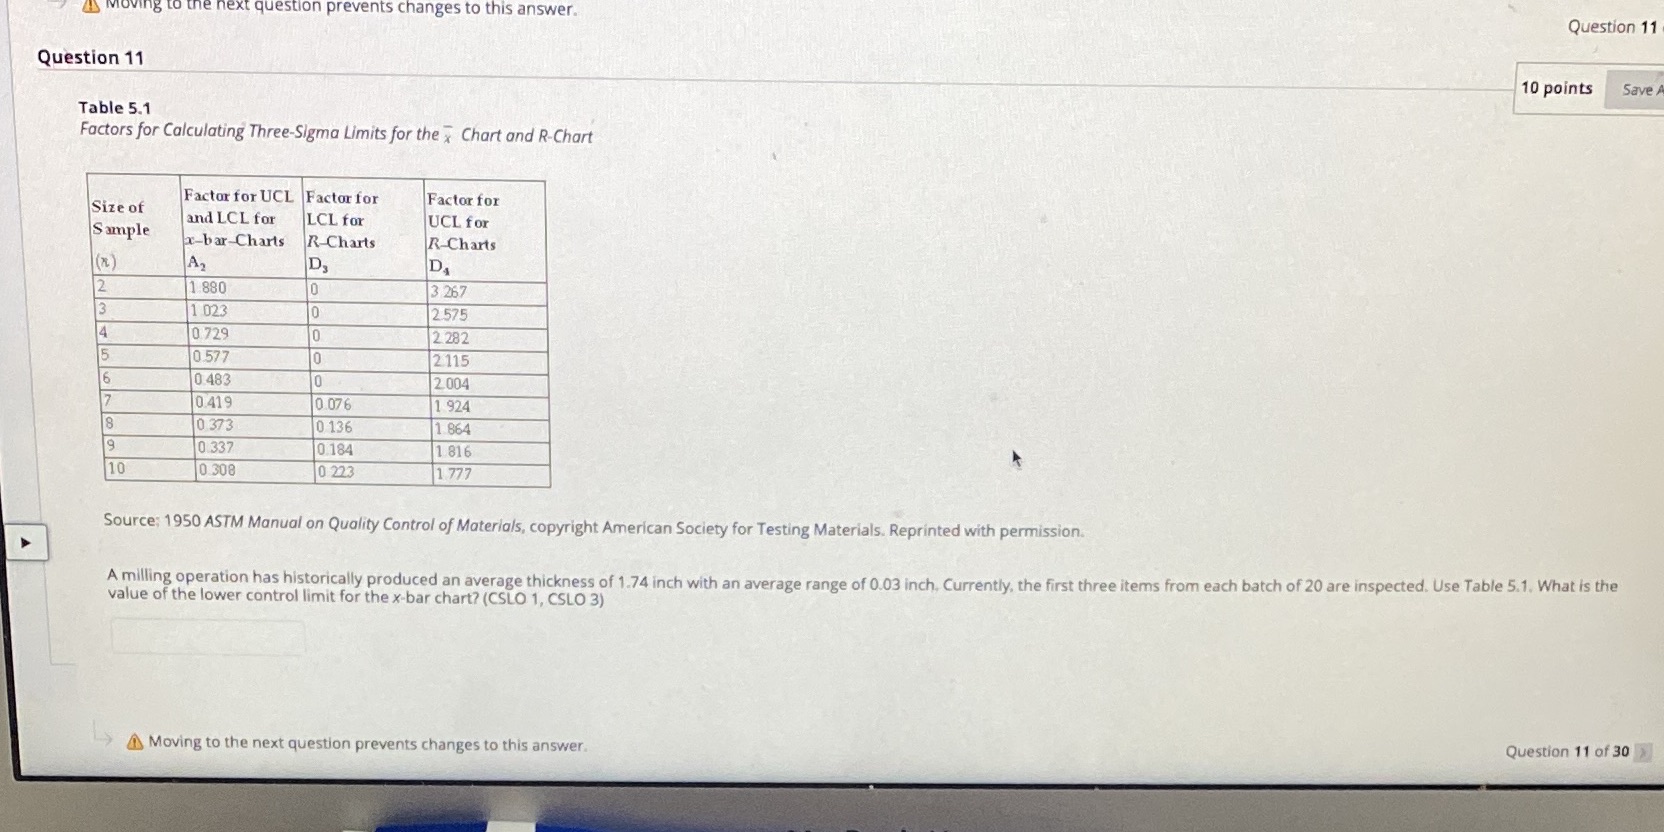
next question prevents changes to this answer. Question 11 Question 11 10 points Save Table 5.1 Factors for Calculating Three-Sigma Limits for the x Chart and R-Chart Size of Factor for UCL Factor for Factor for and LCL for Sample LCL for UCL for x-bar-Charts R-Charts R-Charts A, D, 1 880 0 3 267 1 023 0 2.575 0 729 10 2 282 0.577 10 2 115 0.483 0 2.004 0.419 0.076 1 924 8 0 373 0 136 1 864 9 0 337 0.184 1 816 10 0.308 0 223 1 777 Source: 1950 ASTM Manual on Quality Control of Materials, copyright American Society for Testing Materials. Reprinted with permission. A milling operation has historically produced an average thickness of 1.74 inch with an average range of 0.03 inch, Currently, the first three items from each batch of 20 are inspected. Use Table 5.1. What is the value of the lower control limit for the x-bar chart? (CSLO 1, CSLO 3) Moving to the next question prevents changes to this answer. Question 11 of 30
Step by Step Solution
There are 3 Steps involved in it

Get step-by-step solutions from verified subject matter experts