

Question: Figure 01.1 Figure Q1.2 (a) Figure Q1.1 shows Bode plot of the open-loop part of a unity negative feedback control system shown in Figure Q1.2,
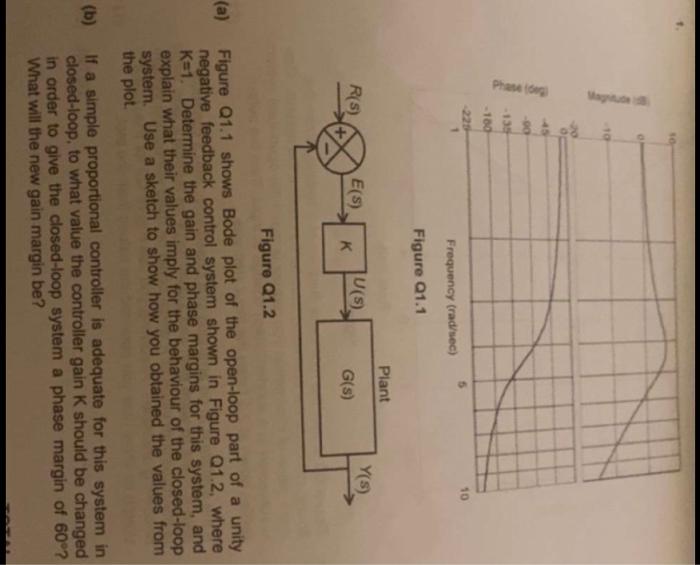
Figure 01.1 Figure Q1.2 (a) Figure Q1.1 shows Bode plot of the open-loop part of a unity negative feedback control system shown in Figure Q1.2, where K=1. Determine the gain and phase margins for this system, and explain what their values imply for the behaviour of the closed-loop system. Use a sketch to show how you obtained the values from the plot. (b) If a simple proportional controller is adequate for this system in closed-loop, to what value the controller gain K should be changed in order to give the closed-loop system a phase margin of 60 ? What will the new gain margin be
Step by Step Solution
There are 3 Steps involved in it
1 Expert Approved Answer
Step: 1 Unlock

Question Has Been Solved by an Expert!
Get step-by-step solutions from verified subject matter experts
Step: 2 Unlock
Step: 3 Unlock