

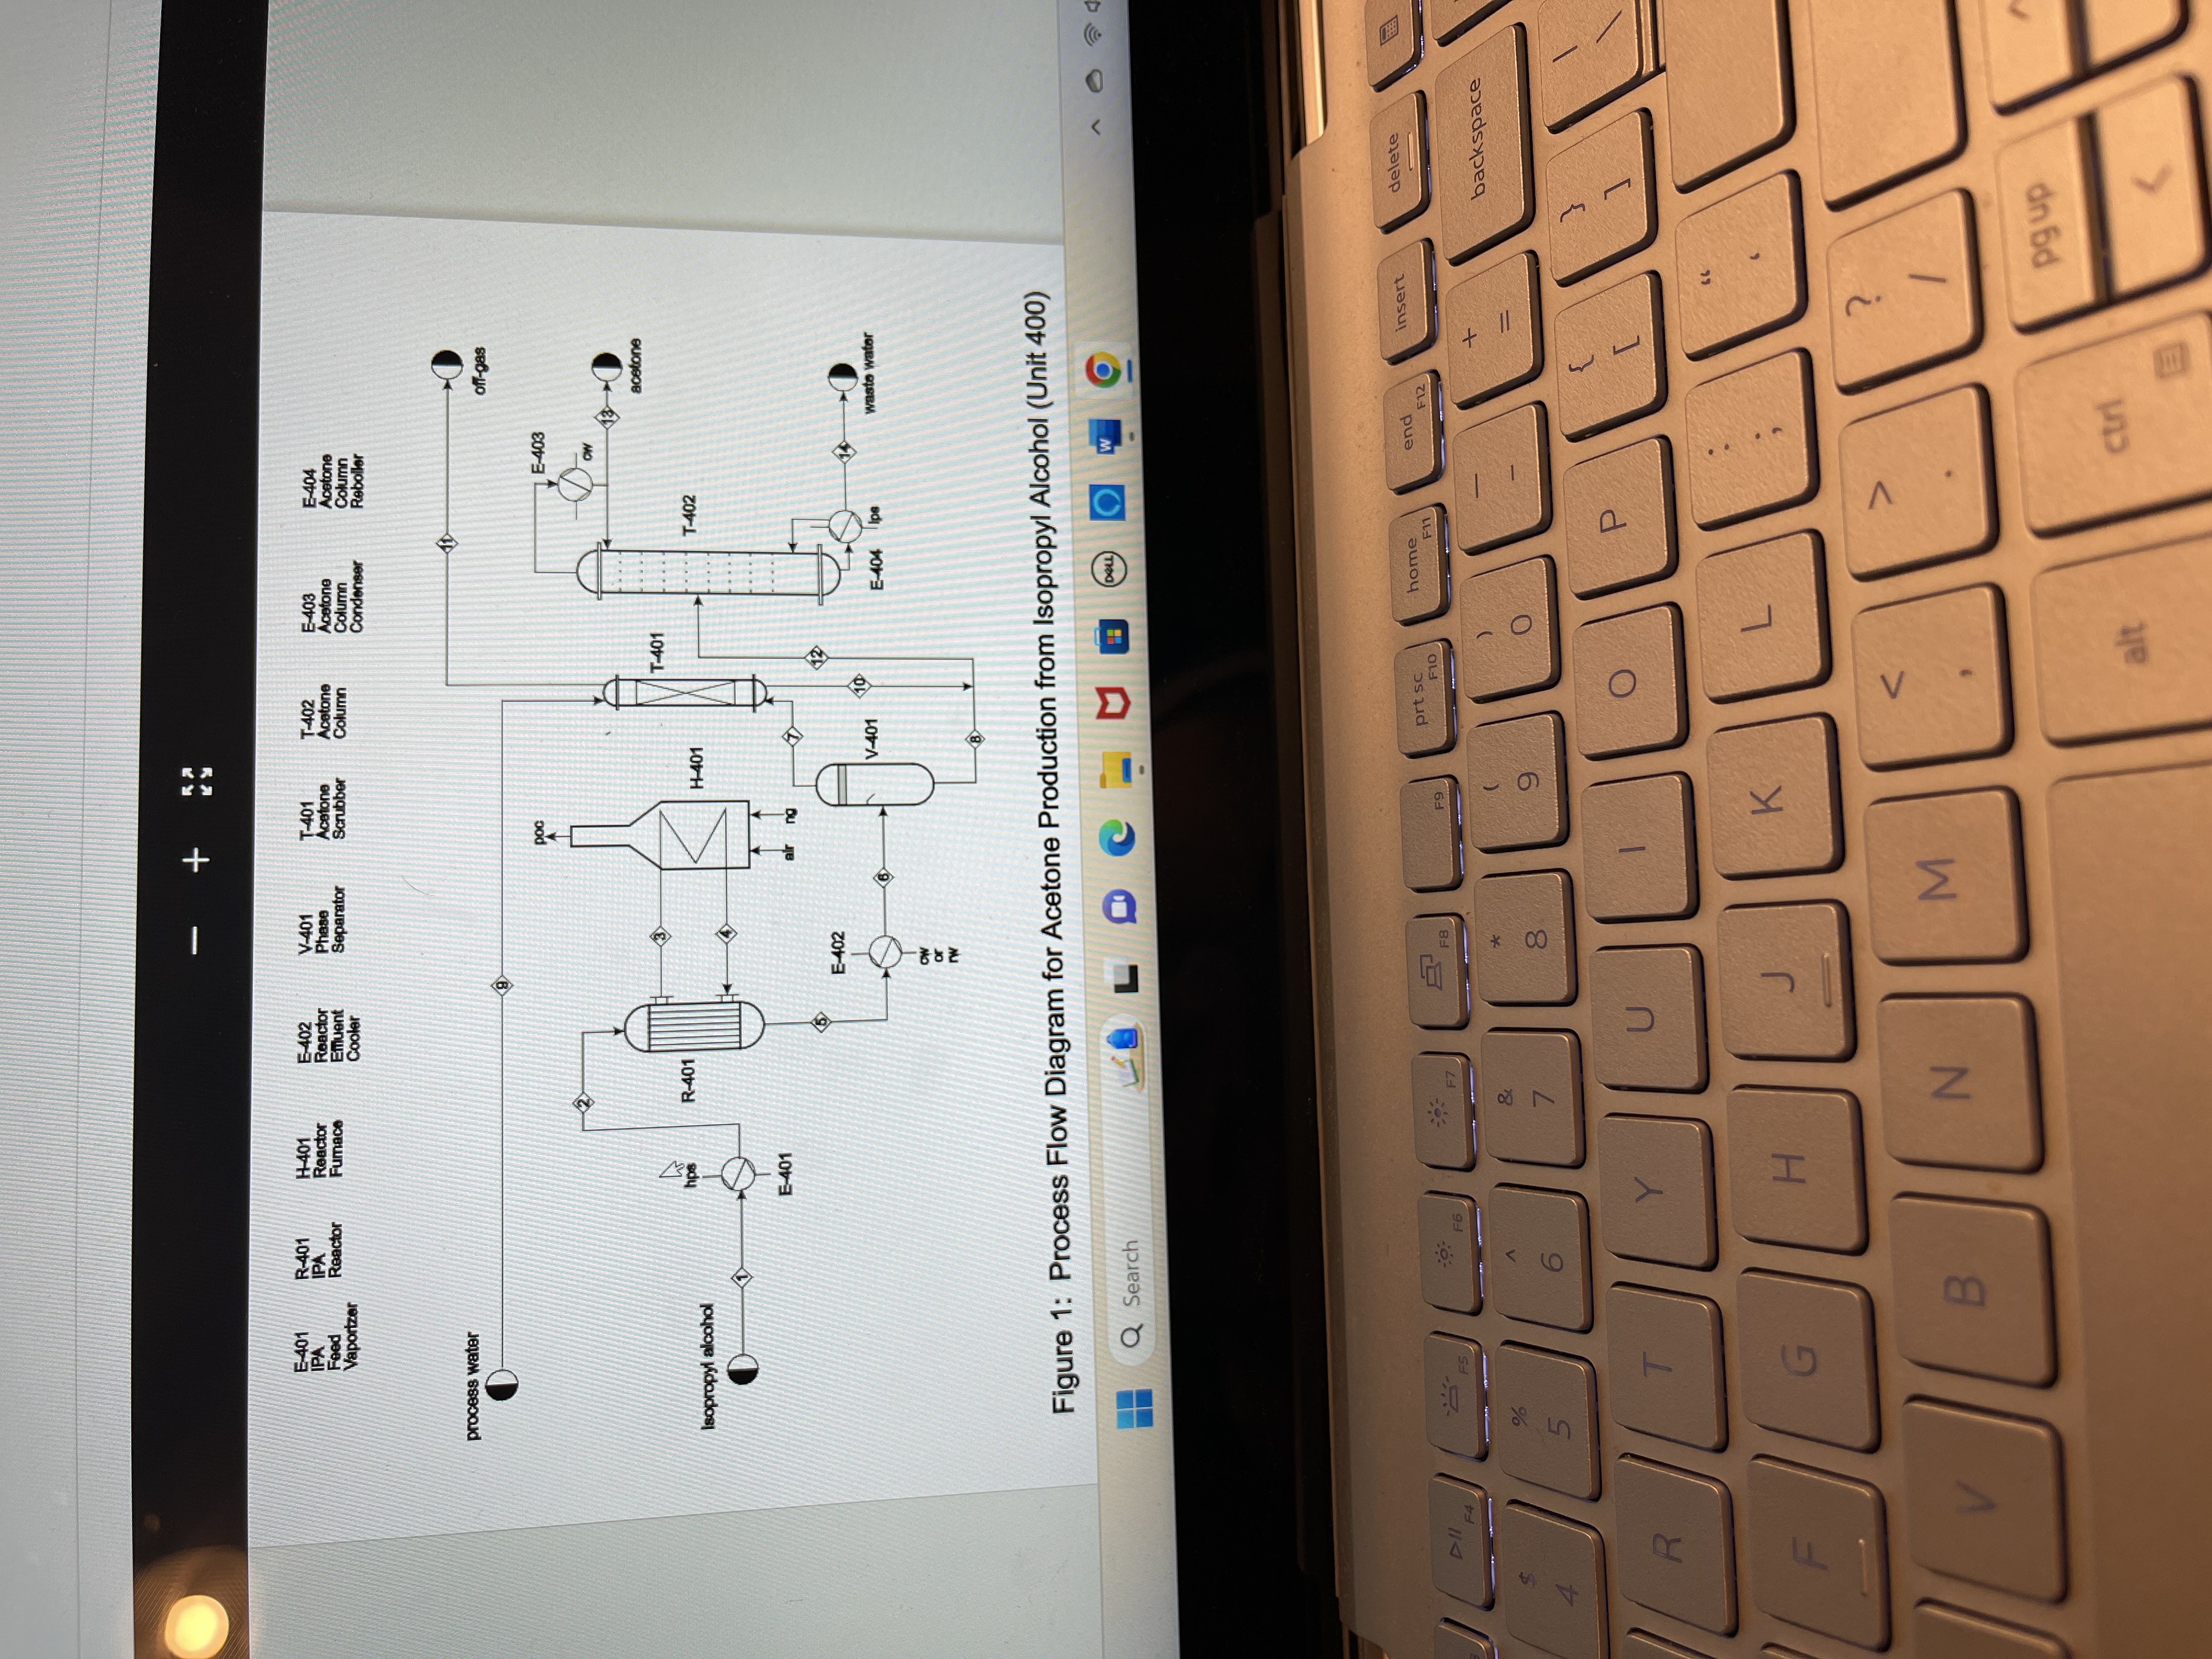
Question: Figure 1 : Process Flow Diagram for Acetone Production from Isopropyl Alcohol ( Unit 4 0 0 ) calculatingT - 4 0 2 Stream In
Figure : Process Flow Diagram for Acetone Production from Isopropyl Alcohol Unit calculatingTStream In : molhr acetone, molhr isopropyl alcohol, molhr waterStream Out Top: molhr acetone, molhr waterStream Out Bottom: molhr acetone, molhr water, molhr isopropyl alcoholTemperaturePressure : oC atmTemperaturePressure Out Top: oC atmTemperaturePressure Out Bottom: oC atmPipe In : inchesPipe Out Top: inchesPipe Out Bottom: inchesHeight in : ftHeight out Top: ftHeight out Bottom: ftDo not worry about the reentering streams just deal with the bottom and top streamsEStream Out Top: molhr acetone, molhr waterTemperaturePressure Top: oC atmTemperaturePressure Exiting: oC atmPipe In Top: inchesPipe Out Exiting: inchesHeight in to out: ftYou are calculating the enthalpies here
Step by Step Solution
There are 3 Steps involved in it
1 Expert Approved Answer
Step: 1 Unlock

Question Has Been Solved by an Expert!
Get step-by-step solutions from verified subject matter experts
Step: 2 Unlock
Step: 3 Unlock