

Question: File Home Insert Draw Page Layout Formulas Data Review View Help Shape Format Share Comments V X LO v ab . Calibri (Body BIU 11
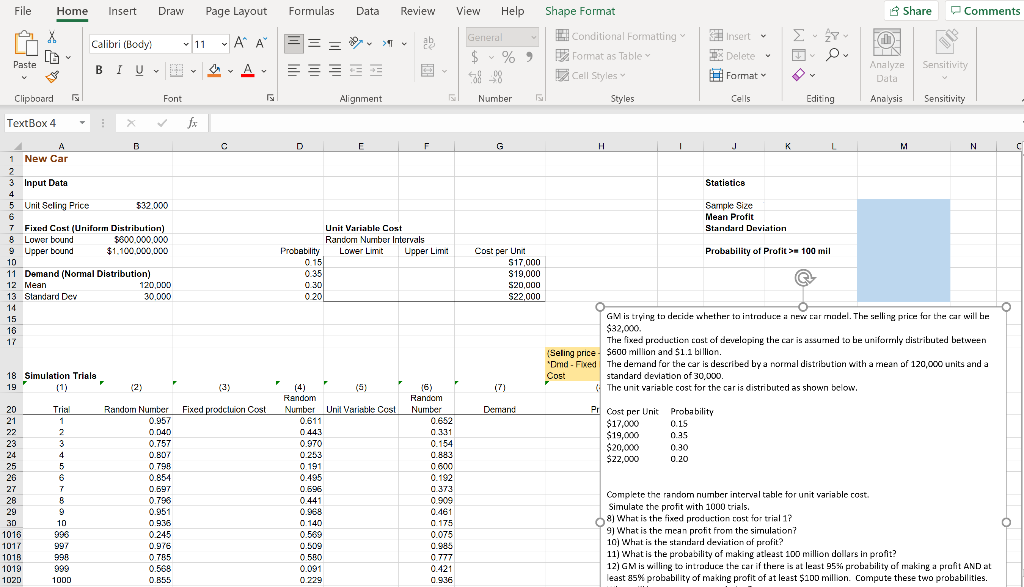
File Home Insert Draw Page Layout Formulas Data Review View Help Shape Format Share Comments V X LO v ab . Calibri (Body BIU 11 AA ===> > A ===== -- General $ % ) 498 Conditional Formatting Format as Table Cell Styles Insert Delete V Paste Sensitivity Format Analyze Dala Clipboard Font Alignment Number Styles Cells Editing Analysis Sensitivity TextBox 4 fx D E F G H 1 J K 1 M N C Statistics Sample Size Mean Profit Standard Deviation A B 1 New Car 2 3 Input Data 4 5 Unit Seling Price $32.000 6 7 () Fixed Cost (Uniform Distribution) 8 Lower bound $800.000.000 9 Upper bound 9 $1,100,000,000 10 11 Demand (Normal Distribution) 12 Mean 120,000 13 Standard Dev 30.000 14 15 16 17 Unit Variable Cost Random Nurnber Intervals Probability Lower Limit Upper Limit 0.15 0.35 Probability of Profit > 100 mil Cost per Unit S17.000 $19,000 $20,000 $22,000 020L 18 Simulation Trials 19 (1) (2) (3) (7) GM is trying to decide whether to introduce a new car model. The selling price for the car will be $32,000. The fixed production cost of developing the car is assured to be uniformly distributed between (Seling price $600 million and $1.2 billion. "Dmd - Fived the demand for the car is described by a normal distribution with a mean of 120,000 units and a Cost standard deviation of 30,000 The unit variable cost for the car is distributed as shown below. . Pr Cost per Unit Probability $17,000 0.15 $19,000 0.2.5 $20,000 0.30 $22,000 0.20 Demand 20 21 22 23 24 25 26 27 28 29 30 1016 1017 1018 Trial 1 2 3 4 5 6 5 7 S 9 10 996 997 999 999 1000 Random Number Fixed prodcluon Cost 0.957 0.040 0.757 0.807 0.796 0.854 0.597 0.798 0.951 0.935 0.245 0.976 0.755 0.568 0.355 (4) (5) Random Nurnber Unil Variable Cost 0.611 0.443 0.970 0.253 0.191 0.495 0.695 0.441 0.968 0 140 0.569 0.509 0500 0.091 0.229 16) Random Number 0.652 0 331 0.154 0.883 0.600 0.192 0.373 0.909 0.461 0.175 0.075 0.985 0777 0.421 0.936 Complete the random number interval table for unit variable cost. Simulate the profit with 1000 trials. 81 What is the fixed production cost for trial 1? 9) What is the mean profit from the simulation? 10) What is the standard deviation of profit? 11) What is the probability of making atleast 100 million dollars in profit? 12) GM is willing to introduce the car i there is at least 95% probability of making a profit AND at least 85% probability of making profit of at least $100 million. Compute these two probabilities. 1019 102D File Home Insert Draw Page Layout Formulas Data Review View Help Shape Format Share Comments V X LO v ab . Calibri (Body BIU 11 AA ===> > A ===== -- General $ % ) 498 Conditional Formatting Format as Table Cell Styles Insert Delete V Paste Sensitivity Format Analyze Dala Clipboard Font Alignment Number Styles Cells Editing Analysis Sensitivity TextBox 4 fx D E F G H 1 J K 1 M N C Statistics Sample Size Mean Profit Standard Deviation A B 1 New Car 2 3 Input Data 4 5 Unit Seling Price $32.000 6 7 () Fixed Cost (Uniform Distribution) 8 Lower bound $800.000.000 9 Upper bound 9 $1,100,000,000 10 11 Demand (Normal Distribution) 12 Mean 120,000 13 Standard Dev 30.000 14 15 16 17 Unit Variable Cost Random Nurnber Intervals Probability Lower Limit Upper Limit 0.15 0.35 Probability of Profit > 100 mil Cost per Unit S17.000 $19,000 $20,000 $22,000 020L 18 Simulation Trials 19 (1) (2) (3) (7) GM is trying to decide whether to introduce a new car model. The selling price for the car will be $32,000. The fixed production cost of developing the car is assured to be uniformly distributed between (Seling price $600 million and $1.2 billion. "Dmd - Fived the demand for the car is described by a normal distribution with a mean of 120,000 units and a Cost standard deviation of 30,000 The unit variable cost for the car is distributed as shown below. . Pr Cost per Unit Probability $17,000 0.15 $19,000 0.2.5 $20,000 0.30 $22,000 0.20 Demand 20 21 22 23 24 25 26 27 28 29 30 1016 1017 1018 Trial 1 2 3 4 5 6 5 7 S 9 10 996 997 999 999 1000 Random Number Fixed prodcluon Cost 0.957 0.040 0.757 0.807 0.796 0.854 0.597 0.798 0.951 0.935 0.245 0.976 0.755 0.568 0.355 (4) (5) Random Nurnber Unil Variable Cost 0.611 0.443 0.970 0.253 0.191 0.495 0.695 0.441 0.968 0 140 0.569 0.509 0500 0.091 0.229 16) Random Number 0.652 0 331 0.154 0.883 0.600 0.192 0.373 0.909 0.461 0.175 0.075 0.985 0777 0.421 0.936 Complete the random number interval table for unit variable cost. Simulate the profit with 1000 trials. 81 What is the fixed production cost for trial 1? 9) What is the mean profit from the simulation? 10) What is the standard deviation of profit? 11) What is the probability of making atleast 100 million dollars in profit? 12) GM is willing to introduce the car i there is at least 95% probability of making a profit AND at least 85% probability of making profit of at least $100 million. Compute these two probabilities. 1019 102D
Step by Step Solution
There are 3 Steps involved in it

Get step-by-step solutions from verified subject matter experts