

Question: FIN 315-05 Question 10, P8-19 (book/static) Homework: Chapter 8. Risk and Return HW Score: 0%, 0 of 20 points O Points: 0 of 1 Part
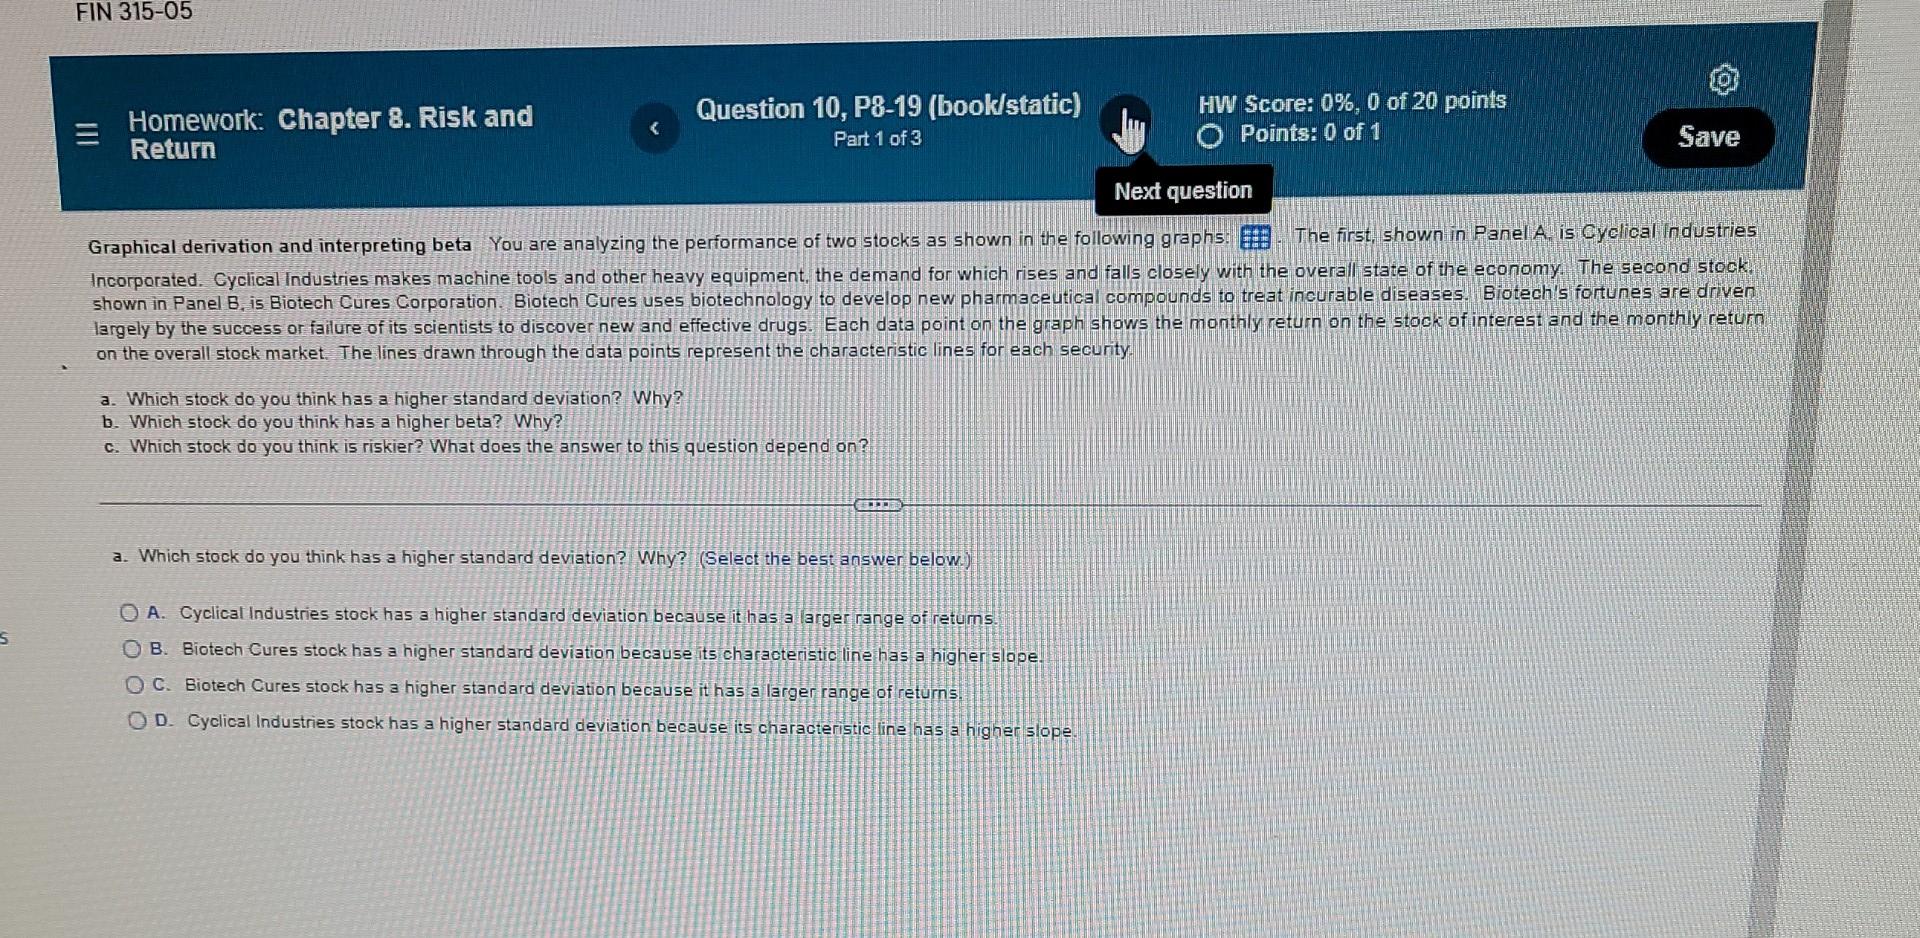
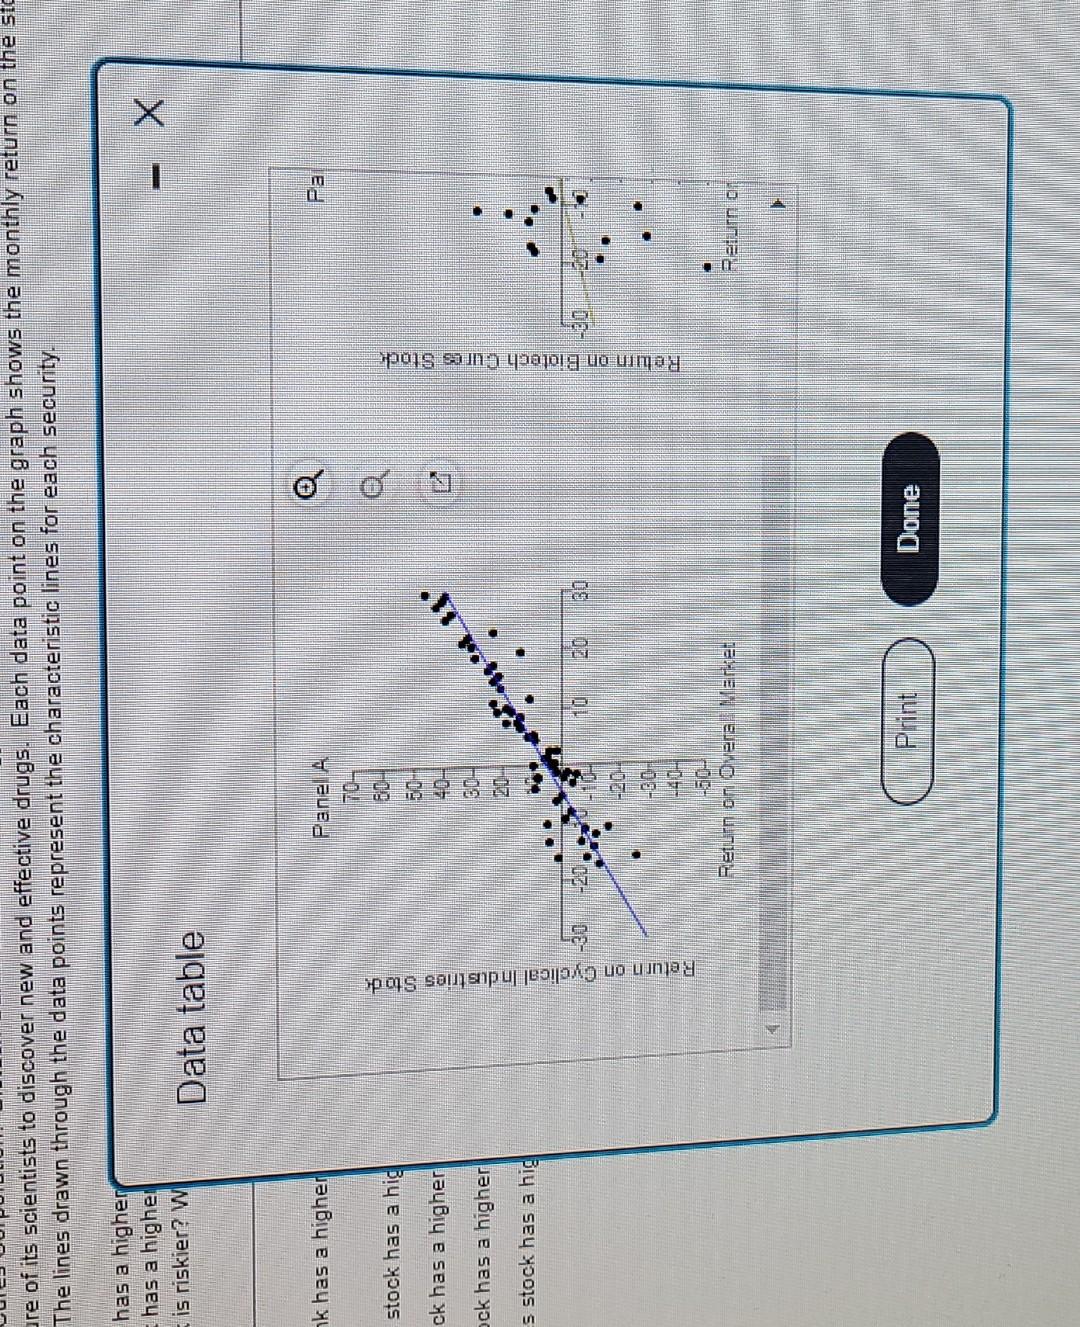
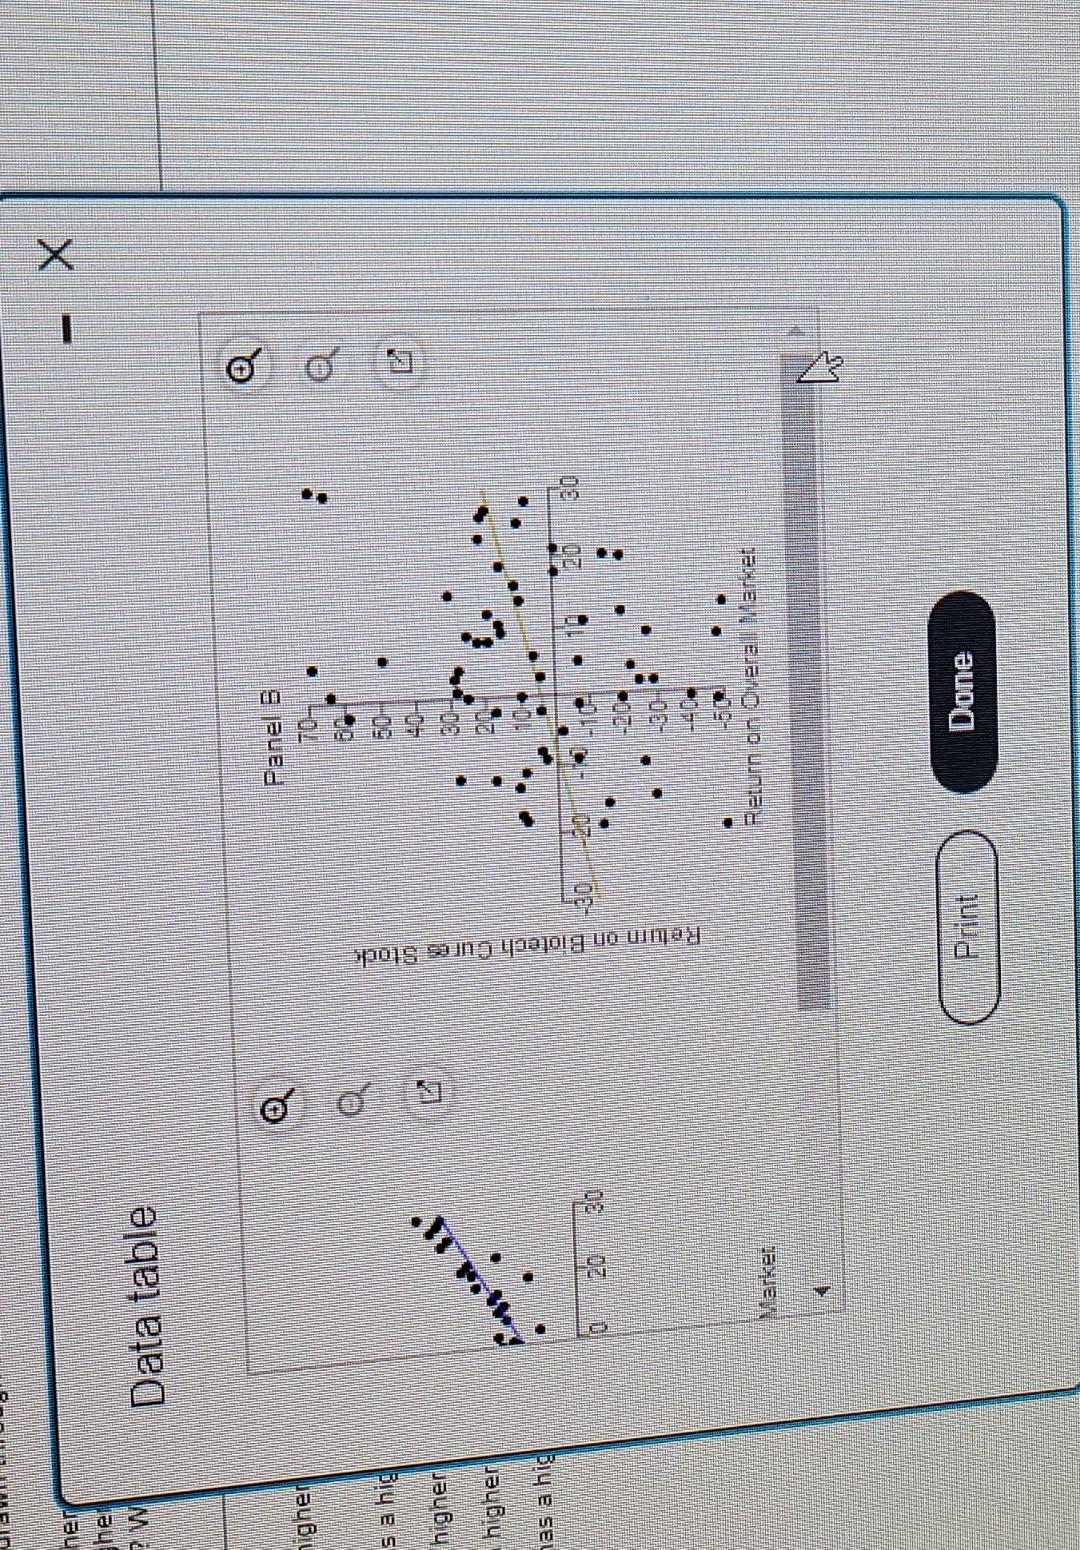
FIN 315-05 Question 10, P8-19 (book/static) Homework: Chapter 8. Risk and Return HW Score: 0%, 0 of 20 points O Points: 0 of 1 Part 1 of 3 Save Next question Graphical derivation and interpreting beta You are analyzing the performance of two stocks as shown in the following graphs: 6. The first, shown in Panel A. is Cyclical Industries Incorporated. Cyclical Industries makes machine tools and other heavy equipment, the demand for which rises and falls closely with the overall state of the economy. The second stook. shown in Panel B. is Biotech Cures Corporation. Biotech Cures uses biotechnology to develop new pharmaceutical compounds to treat incurable diseases. Biotech's fortunes are driven largely by the success or failure of its scientists to discover new and effective drugs. Each data point on the graph shows the monthly return on the stock of interest and the monthly retur on the overall stock market. The lines drawn through the data points represent the characteristic lines for each security a. Which stock do you think has a higher standard deviation? Why? b. Which stock do you think has a higher beta? Why? C. Which stock do you think is riskier? What does the answer to this question depend on?! SER a. Which stock do you think has a higher standard deviation? Why? (Select the best answer below.) s O A. Cyclical Industries stock has a higher standard deviation because it has a larger range of retums. OB Biotech Cures stock has a higher standard deviation because its characteristic line has a higher slope. O C. Biotech Cures stock has a higher standard deviation because it has a larger range of returns OD. Cyclical Industries stock has a higher standard deviation because its characteristic line has a higher slope. are of its scientists to discover new and effective drugs. Each data point on the graph shows the monthly return on the sto The lines drawn through the data points represent the characteristic lines for each security. has a higher has a higher is riskier? W X Data table k has a higher Pa stock has a hig Pane A 70- 604 50-4 40- GO- ck has a higher ock has a higher s stock has a hig Return on Cyclical Industries Stock Return on Biotech Cures Stock 10 20 30 -20- -GO -40H 10H Return on overa. Merke: Berun. 01 Pirint Done - X her her 7 W Data table @ Panel 5 TO higher sa hig higher 17 Ements higher Return on Biotech Cures Stock has a hig Return an vera armet Market Print Done
Step by Step Solution
There are 3 Steps involved in it

Get step-by-step solutions from verified subject matter experts