

Question: Financial Statement Analysis Ratio Problem. See Below for financial statements and answer the ratios for 2017E as well as the following. Remember to discuss overall
Financial Statement Analysis Ratio Problem.
See Below for financial statements and answer the ratios for 2017E as well as the following. Remember to discuss overall performance of not only each ratio but also the trend and industry comparison. Offer suggestions of how areas can improved and why.
A. Analyze the historical trend of the company and also compared to the industry of each of the ratios and discuss. Show all work and be as comprehensive as possible with your reposes. How important is financial statements and ratio analysis here?
B. Discuss the overall performance of the company compared to itself and the industry. Discuss any areas of improvement. What is your recommendation to company management? What is your recommendation to company shareholders?
C. What are 2 problems and 2 benefits of ratio financial ratios. What are 2 limitation of historical trends and benchmarking companies. Briefly discuss and give real examples.
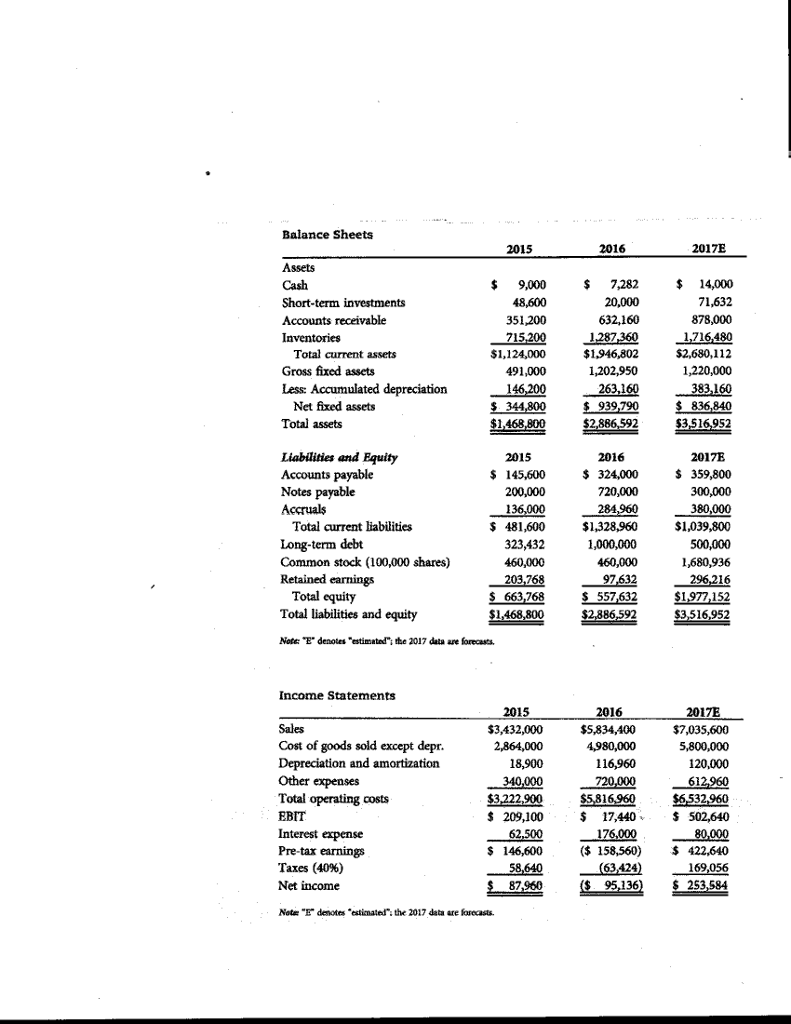
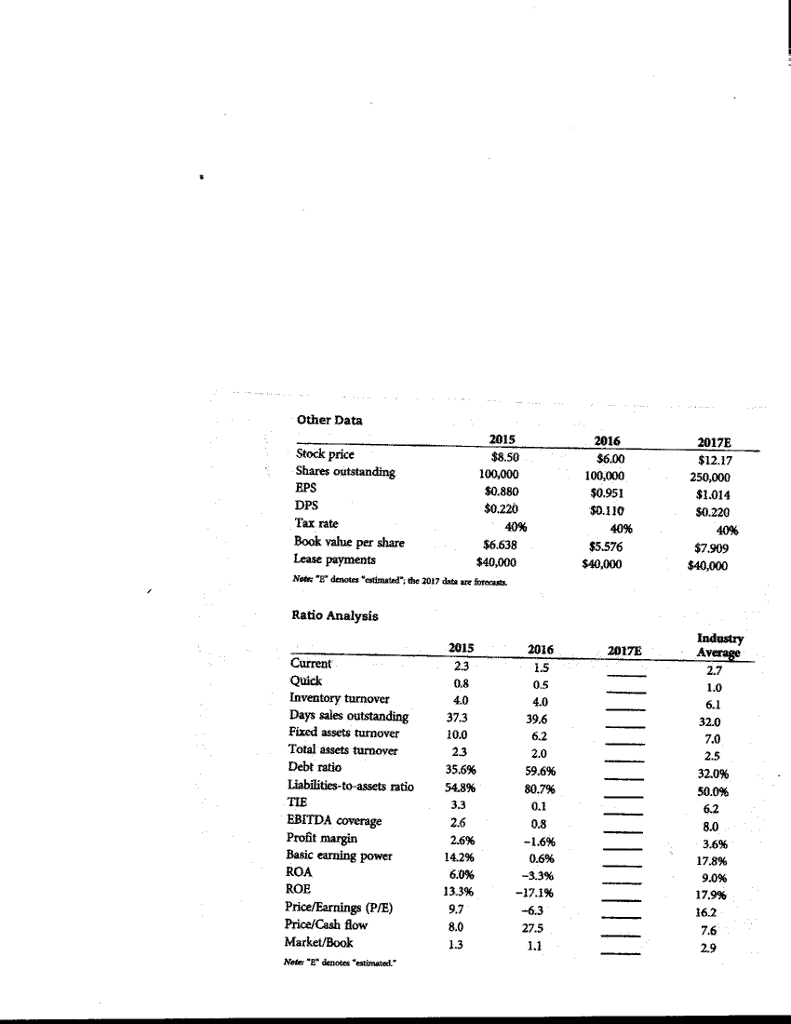
6 1287,360 $1,124,000 1,468 $1,039,800 Common stock (100,000 shares) 2 Total liabilities and equity $1,468,800 Note E denotes estimated the 2017 data are forecasts. Income Statements Cost of goods sold except depr Depreciation and amortization costs $5,816960 S 17,440 v 502,640 146,600 Nate-r denotes "estimater. the 2017 dat are forecasts. Other Data 100,000 40% Book value per share Notr "E denotes "timd the 2017 data are forecasts Industry 39.6 assets turnover Total assets turnover Liabilities-to-assets ratio 54.8% power Price/Earnings (P/E) Note "E denotes "estimated. 6 1287,360 $1,124,000 1,468 $1,039,800 Common stock (100,000 shares) 2 Total liabilities and equity $1,468,800 Note E denotes estimated the 2017 data are forecasts. Income Statements Cost of goods sold except depr Depreciation and amortization costs $5,816960 S 17,440 v 502,640 146,600 Nate-r denotes "estimater. the 2017 dat are forecasts. Other Data 100,000 40% Book value per share Notr "E denotes "timd the 2017 data are forecasts Industry 39.6 assets turnover Total assets turnover Liabilities-to-assets ratio 54.8% power Price/Earnings (P/E) Note "E denotes "estimated
Step by Step Solution
There are 3 Steps involved in it

Get step-by-step solutions from verified subject matter experts