

Question: Find the Trend and Level Date Index Date (numeric) 9/3/2010 10,448.58 40424 9/7/2010 10,339.53 40428 9/8/2010 10,386.28 40429 9/9/2010 10,415.59 40430 9/10/2010 10,463.87 40431 9/13/2010
 Find the Trend and Level
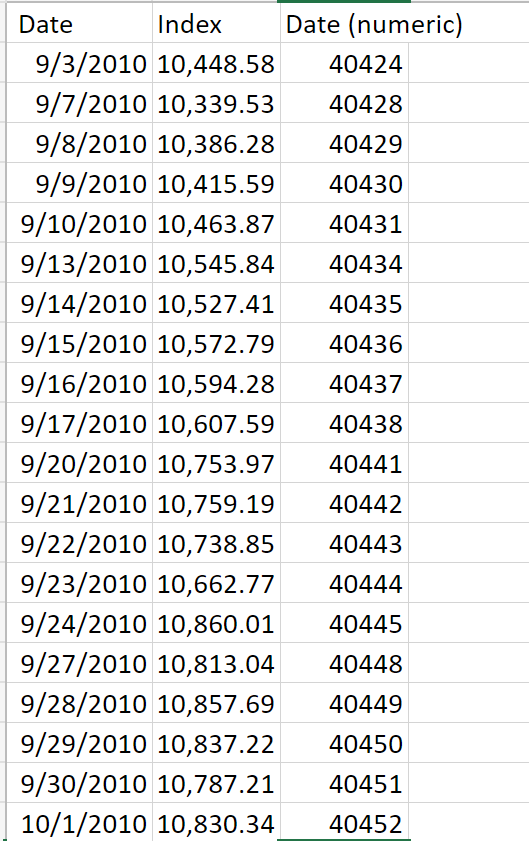
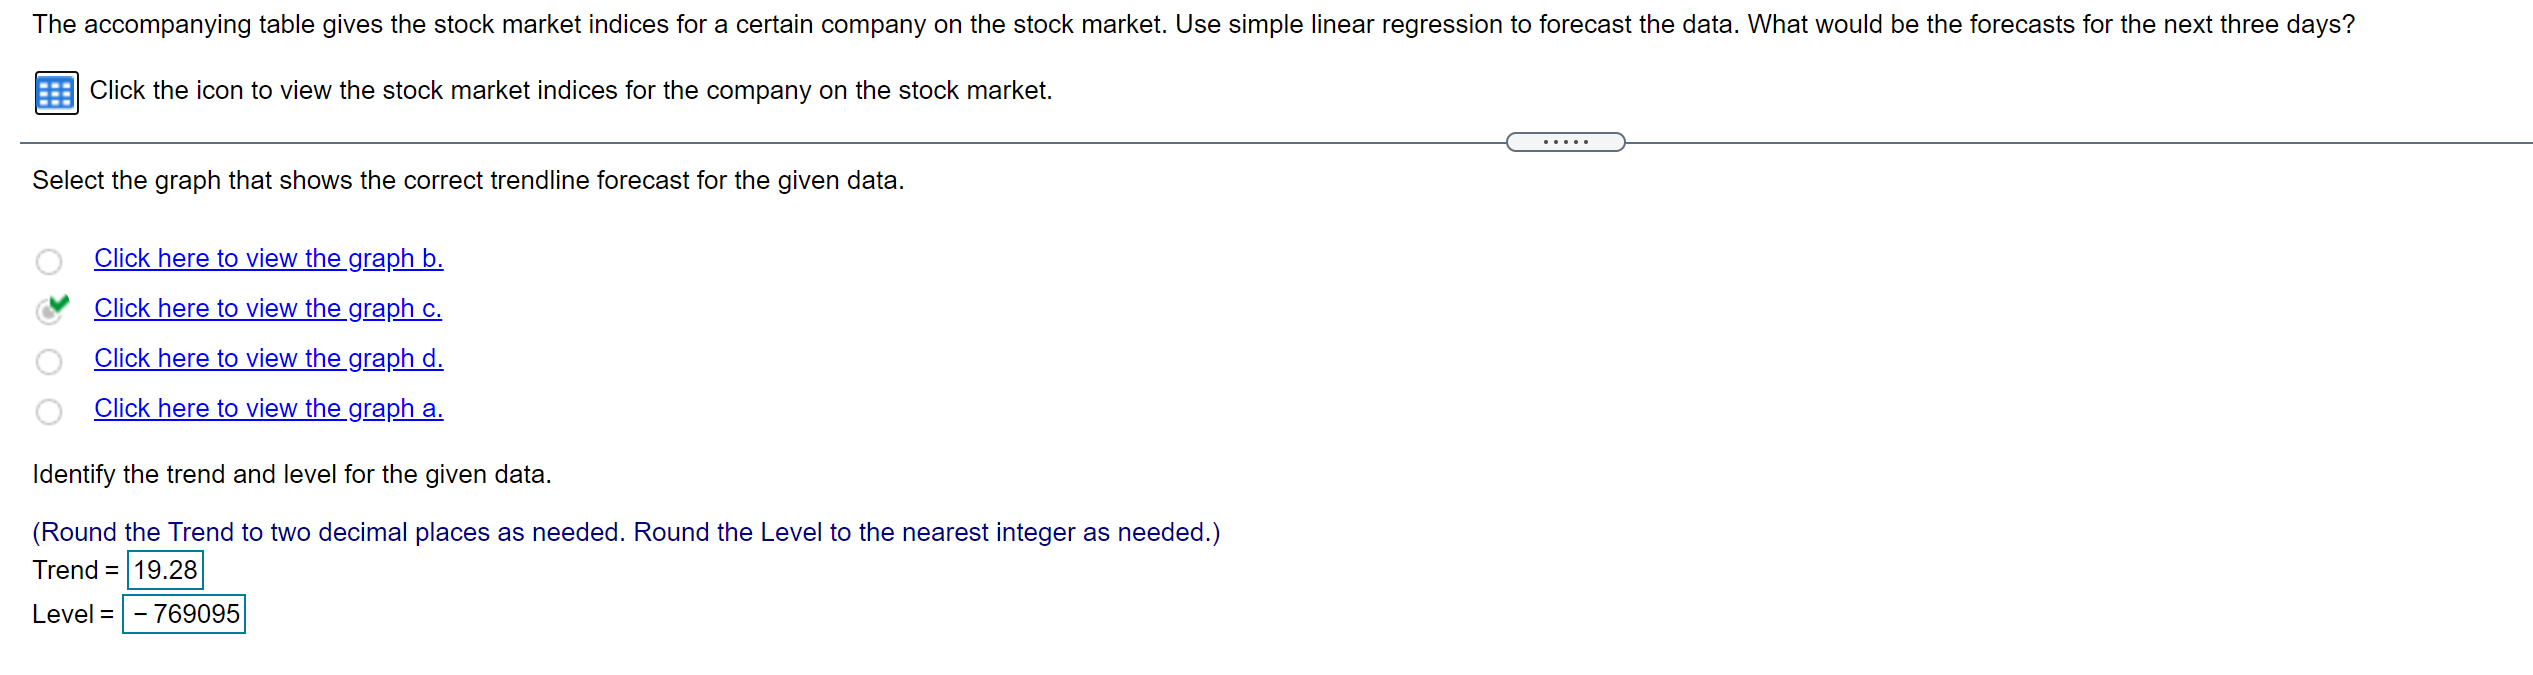
Date Index Date (numeric) 9/3/2010 10,448.58 40424 9/7/2010 10,339.53 40428 9/8/2010 10,386.28 40429 9/9/2010 10,415.59 40430 9/10/2010 10,463.87 40431 9/13/2010 10,545.84 40434 9/14/2010 10,527.41 40435 9/15/2010 10,572.79 40436 9/16/2010 10,594.28 40437 9/17/2010 10,607.59 40438 9/20/2010 10,753.97 40441 9/21/2010 10,759.19 40442 9/22/2010 10,738.85 40443 9/23/2010 10,662.77 40444 9/24/2010 10,860.01 40445 9/27/2010 10,813.04 40448 9/28/2010 10,857.69 40449 9/29/2010 10,837.22 40450 9/30/2010 10,787.21 40451 10/1/2010 10,830.34 40452 The accompanying table gives the stock market indices for a certain company on the stock market. Use simple linear regression to forecast the data. What would be the forecasts for the next three days? Click the icon to view the stock market indices for the company on the stock market. Select the graph that shows the correct trendline forecast for the given data. Click here to view the graph b. Click here to view the graph c. Click here to view the graph d. Click here to view the graph a. Identify the trend and level for the given data. (Round the Trend to two decimal places as needed. Round the Level to the nearest integer as needed.) Trend = 19.28 Level = - 769095
Step by Step Solution
There are 3 Steps involved in it

Get step-by-step solutions from verified subject matter experts