

Question: Following or two weekly forecast made by two different methods for the number of gallons of gasoline, and thousands, demanded at a local gasoline station.
Following or two weekly forecast made by two different methods for the number of gallons of gasoline, and thousands, demanded at a local gasoline station. Also shown her actual demand levels, and thousands of gallons: 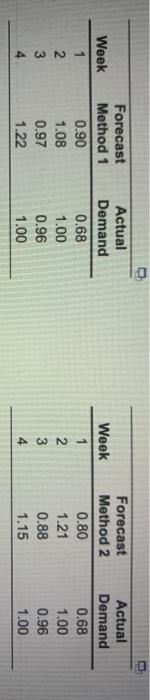
Week 1 Week 1 Forecast Method 1 0.90 1.08 0.97 1.22 Actual Demand 0.68 1.00 0.96 1.00 Forecast Method 2 0.80 1.21 0.88 1.15 Actual Demand 0.68 1.00 0.96 1.00 WN 4
a) the MAD for method 1-
b) the mean squared error for method 1- (thousand gallons ^2)
c) the MAD for method 2- thousand gallons
d) the mean squared error for method 2- thousand gallons
Step by Step Solution
There are 3 Steps involved in it
1 Expert Approved Answer
Step: 1 Unlock

Question Has Been Solved by an Expert!
Get step-by-step solutions from verified subject matter experts
Step: 2 Unlock
Step: 3 Unlock