

Question: For each data set below, determine the mathematical expression. To do this, first graph the original data. Assume the 1st column in each set
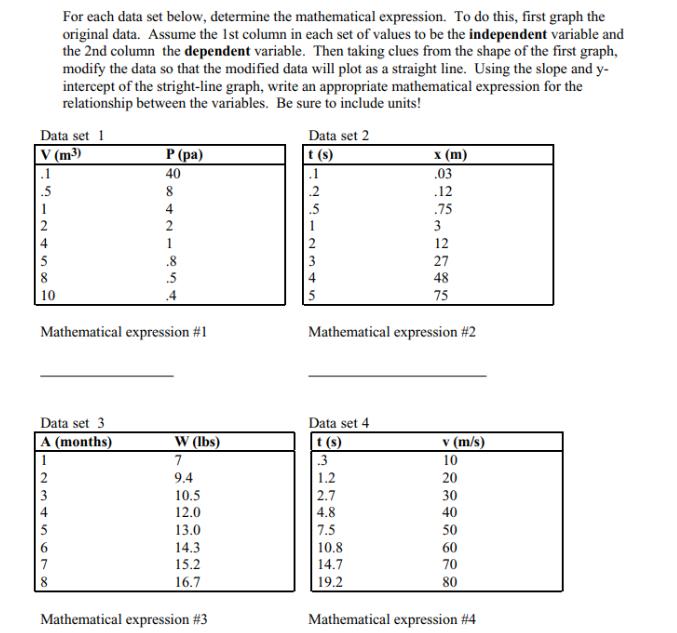
For each data set below, determine the mathematical expression. To do this, first graph the original data. Assume the 1st column in each set of values to be the independent variable and the 2nd column the dependent variable. Then taking clues from the shape of the first graph, modify the data so that the modified data will plot as a straight line. Using the slope and y- intercept of the stright-line graph, write an appropriate mathematical expression for the relationship between the variables. Be sure to include units! Data set 1 V (m) P (pa) 40 Data set 2 t(s) x (m) .1 .1 .03 .5 8 4 .2 .12 .5 .75 2 2 1 3 4 1 588 854 .5 234 12 27 48 10 Mathematical expression #1 Mathematical expression #2 75 Data set 3 A (months) 2 69 Data set 4 W (lbs) t(s) v (m/s) 7 .3 10 9.4 1.2 20 10.5 2.7 30 12.0 4.8 40 13.0 7.5 50 14.3 10.8 60 15.2 14.7 70 16.7 19.2 80 Mathematical expression #3 Mathematical expression #4
Step by Step Solution
There are 3 Steps involved in it
To determine the mathematical expressions for the relationships between the variables in each data set we will first plot the original data and then modify the data to obtain a straightline graph From ... View full answer

Get step-by-step solutions from verified subject matter experts