

Question: For Problems 20-22, download the spreadsheet containing the data used to prepare lable 5.3 , Rates of return, 1927- 2016. included with the question. NR
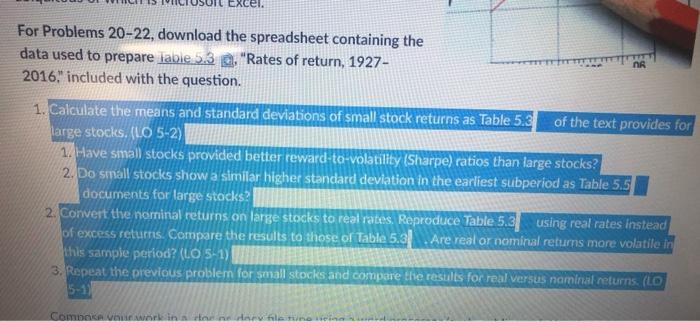
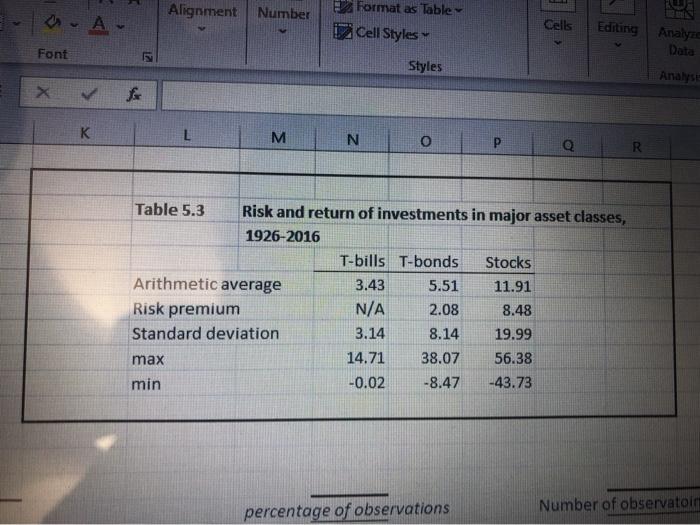
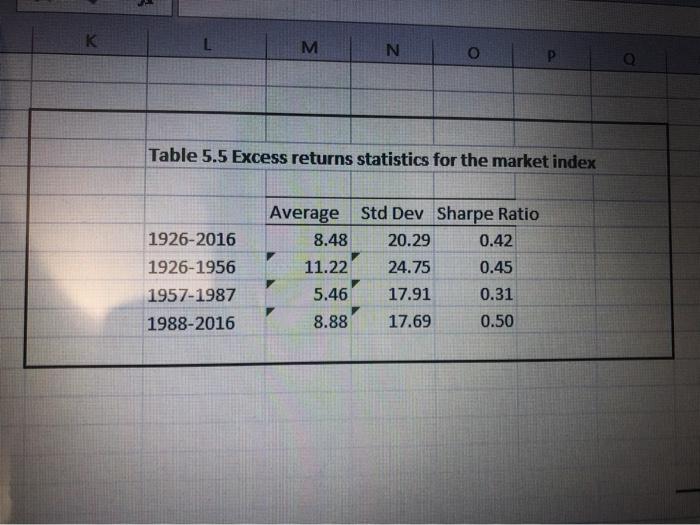
For Problems 20-22, download the spreadsheet containing the data used to prepare lable 5.3 , "Rates of return, 1927- 2016." included with the question. NR 1. Calculate the means and standard deviations of small stock returns as Table 5.3 of the text provides for large stocks. (LO 5-2) 1. Have small stocks provided better reward-to-volatility (Sharpe) ratios than large stocks? 2. Do small stocks show a similar higher standard deviation in the earliest subperiod as Table 5.5 documents for large stocks? 2. Convert the nominal returns on large stocks to real rates. Reproduce Table 5.3 using real rates instead of excess retums. Compare the results to those of Table 5.3 Are real or nominal returns more volatile in this sample period? (LO S-1) 3. Repeat the previous problem for small stocks and compare the results for real versus nominal returns. (LO Comnce your work in tornary file in Alignment Number - A - Format as Table 12 Cell Styles Cells Editing Analyze Font Data Styles Analyse K L M N O R Table 5.3 Risk and return of investments in major asset classes, 1926-2016 T-bills T-bonds Stocks Arithmetic average 3.43 5.51 11.91 Risk premium N/A 2.08 8.48 Standard deviation 3.14 8.14 19.99 max 14.71 38.07 56.38 min -0.02 -8.47 -43.73 percentage of observations Number of observatoir M N O Table 5.5 Excess returns statistics for the market index 1926-2016 1926-1956 1957-1987 Average 8.48 11.22 5.46 8.88 Std Dev Sharpe Ratio 20.29 0.42 24.75 0.45 17.91 0.31 17.69 0.50 1988-2016 For Problems 20-22, download the spreadsheet containing the data used to prepare lable 5.3 , "Rates of return, 1927- 2016." included with the question. NR 1. Calculate the means and standard deviations of small stock returns as Table 5.3 of the text provides for large stocks. (LO 5-2) 1. Have small stocks provided better reward-to-volatility (Sharpe) ratios than large stocks? 2. Do small stocks show a similar higher standard deviation in the earliest subperiod as Table 5.5 documents for large stocks? 2. Convert the nominal returns on large stocks to real rates. Reproduce Table 5.3 using real rates instead of excess retums. Compare the results to those of Table 5.3 Are real or nominal returns more volatile in this sample period? (LO S-1) 3. Repeat the previous problem for small stocks and compare the results for real versus nominal returns. (LO Comnce your work in tornary file in Alignment Number - A - Format as Table 12 Cell Styles Cells Editing Analyze Font Data Styles Analyse K L M N O R Table 5.3 Risk and return of investments in major asset classes, 1926-2016 T-bills T-bonds Stocks Arithmetic average 3.43 5.51 11.91 Risk premium N/A 2.08 8.48 Standard deviation 3.14 8.14 19.99 max 14.71 38.07 56.38 min -0.02 -8.47 -43.73 percentage of observations Number of observatoir M N O Table 5.5 Excess returns statistics for the market index 1926-2016 1926-1956 1957-1987 Average 8.48 11.22 5.46 8.88 Std Dev Sharpe Ratio 20.29 0.42 24.75 0.45 17.91 0.31 17.69 0.50 1988-2016
Step by Step Solution
There are 3 Steps involved in it

Get step-by-step solutions from verified subject matter experts