

Question: For Problems 2022, download the spreadsheet containing the data used to prepare Table 5.3, Rates of return, 19262013, from Connect. 20. Calculate the same subperiod
For Problems 2022, download the spreadsheet containing the data used to prepare Table 5.3, Rates of return, 19262013, from Connect. 20. Calculate the same subperiod means and standard deviations for small stocks as Table 5.4 of the text provides for large stocks. (LO 5-2) a. Have small stocks provided better reward-to-volatility (Sharpe) ratios than large stocks? b. Do small stocks show a similar higher standard deviation in the earliest subperiod as Table 5.4 documents for large stocks?
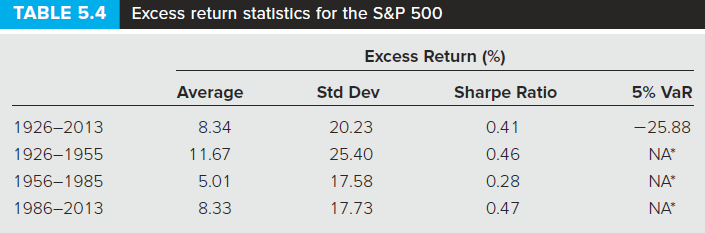
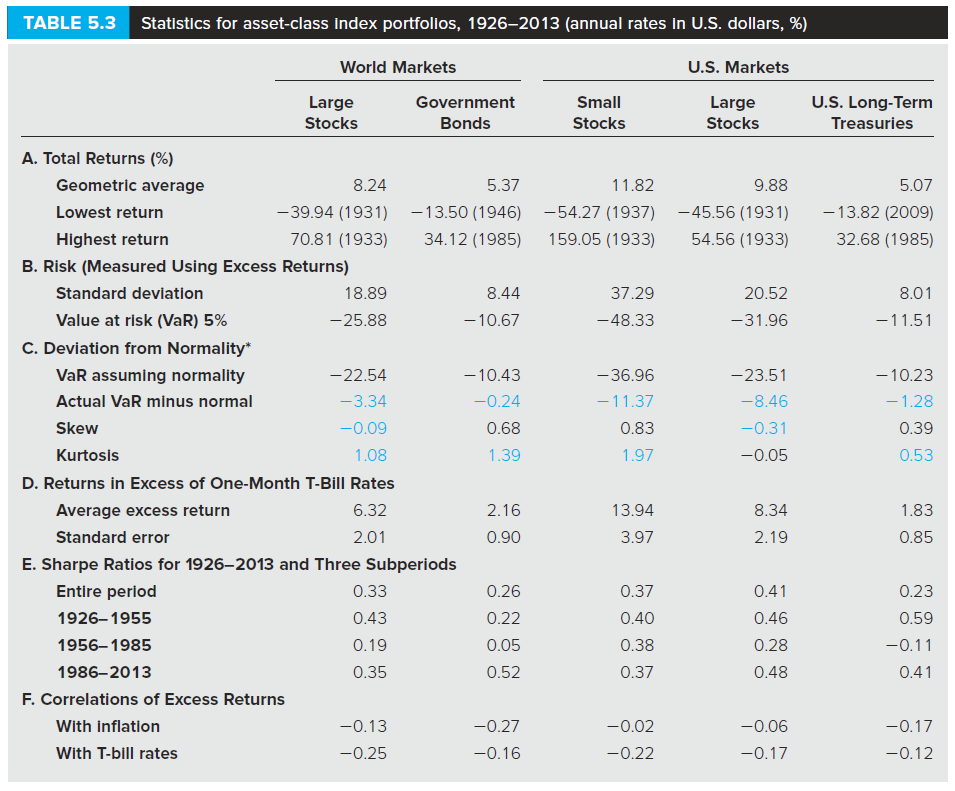
TABLE 5.4 Excess return statistics for the S&P 500 Excess Return Average Std Dev Sharpe Ratio 0.41 1926-2013 8.34 20.23 11.67 1926-1955 0.46 25.40 5.01 1956-1985 0.28 17.58 17.73 0.47 1986-2013 8.33 5% VaR 25.88 NA NA* NA TABLE 5.4 Excess return statistics for the S&P 500 Excess Return Average Std Dev Sharpe Ratio 0.41 1926-2013 8.34 20.23 11.67 1926-1955 0.46 25.40 5.01 1956-1985 0.28 17.58 17.73 0.47 1986-2013 8.33 5% VaR 25.88 NA NA* NA
Step by Step Solution
There are 3 Steps involved in it

Get step-by-step solutions from verified subject matter experts