

Question: For Problems 20-22, download the spreadsheet containing the data used to prepare Table 5.3 Download Table 5.3 , Rates of return, 1927-2016, included with the
For Problems 20-22, download the spreadsheet containing the data used to prepare Table 5.3 Download Table 5.3, "Rates of return, 1927-2016," included with the question.
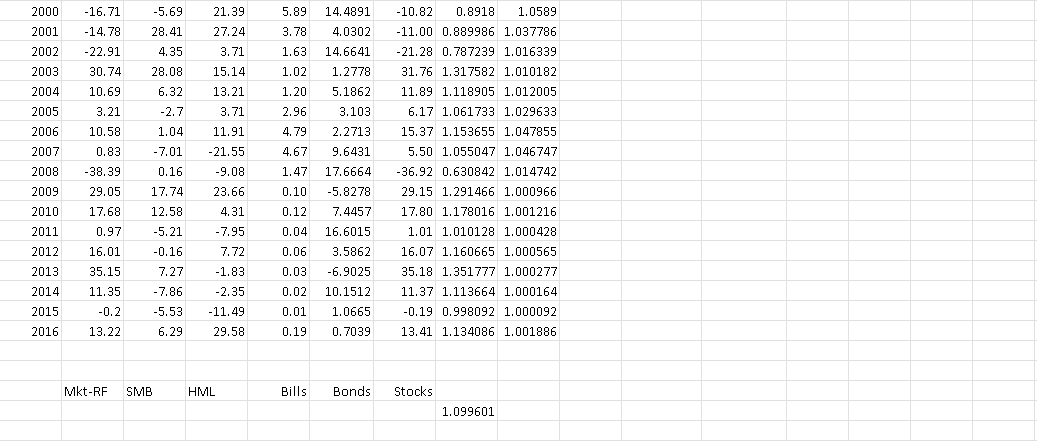
- Calculate the means and standard deviations of small stock returns as Table 5.3 Download Table 5.3of the text provides for large stocks.(LO 5-2)
- Have small stocks provided better reward-to-volatility (Sharpe) ratios than large stocks?
- Do small stocks show a similar higher standard deviation in the earliest subperiod as Table 5.5 Download Table 5.5documents for large stocks?
- Convert the nominal returns on large stocks to real rates. Reproduce Table 5.3 Download Table 5.3using real rates instead of excess returns. Compare the results to those of Table 5.3 Download Table 5.3. Are real or nominal returns more volatile in this sample period?(LO 5-1)
- Repeat the previous problem for small stocks and compare the results for real versus nominal returns.(LO 5-1)
Compose your work in a .doc or .docx file type using a word processor (such as Microsoft Word, etc.). Check your work and correct any spelling or grammatical errors.
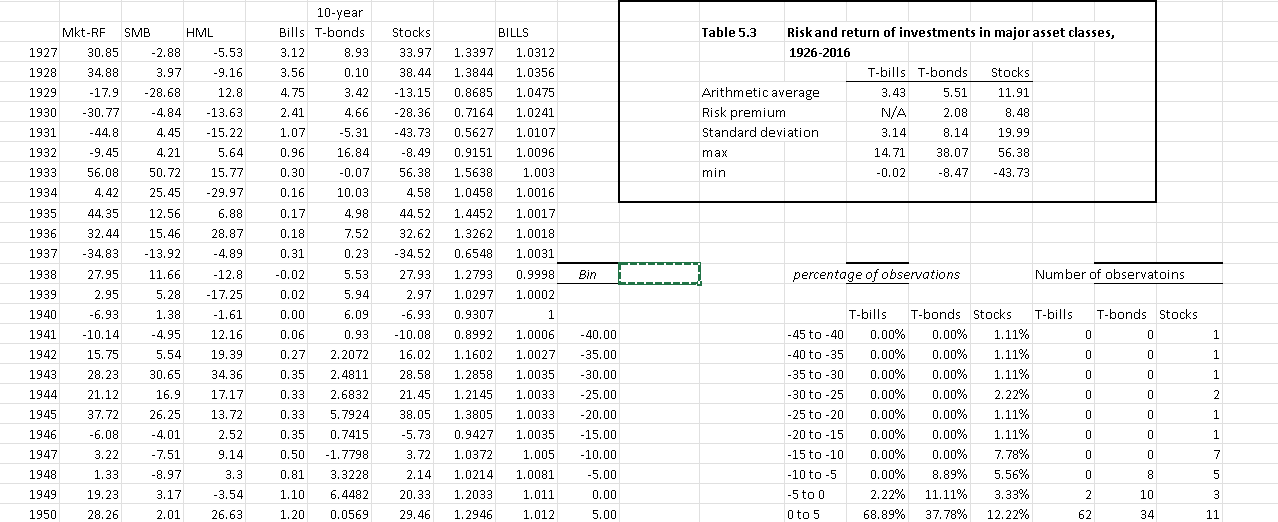
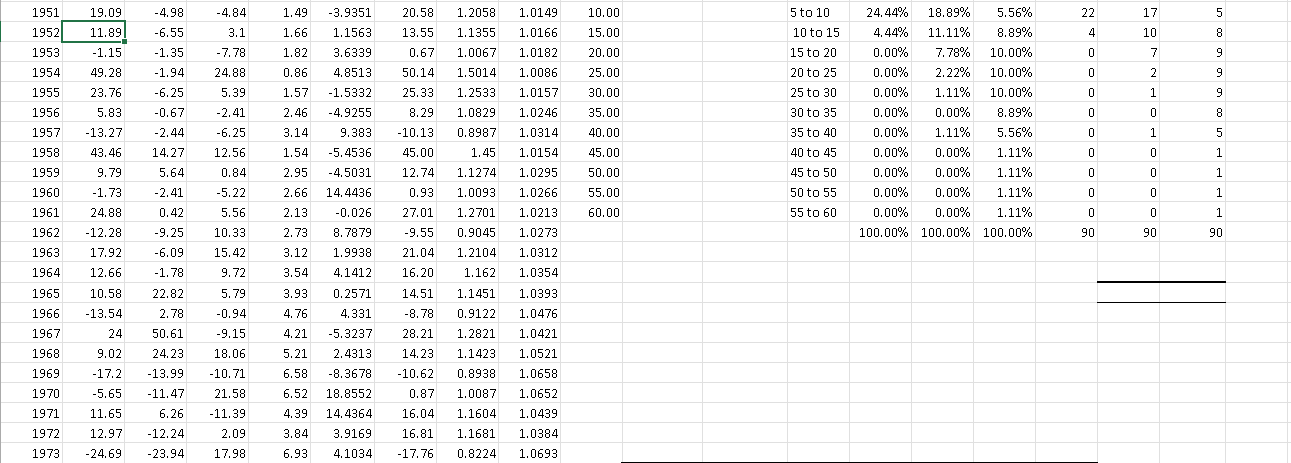
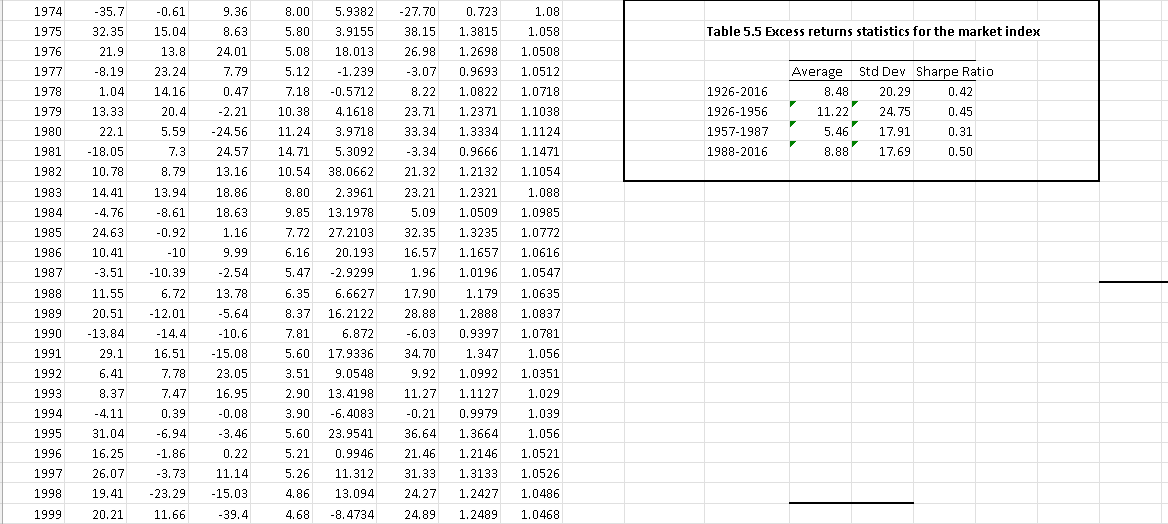
10-year Mkt-RF SMB HML Bills T-bonds Stocks BILLS Table 5.3 Risk and return of investments in major asset classes, 1927 30.85 -2.88 -5.53 3.12 8.93 33.97 1.3397 1.0312 1926-2016 1928 34.88 3.97 -9.16 3.56 0.10 38. 44 1.3844 1.0356 T-bills T-bonds Stocks 1929 -17.9 -28.68 12.8 4.75 3.42 -13.15 0.8685 1.0475 Arithmetic average 3.43 5.51 11.91 1930 -30.77 -4.84 -13.63 2.41 4.66 -28.36 0. 7164 1.0241 Risk premium N/A 2.08 8.48 1931 -44.8 4.45 -15.22 1.07 -5.31 -43.73 0.5627 1. 0107 Standard deviation 3.14 8.14 19.99 1932 -9.45 4.21 5.64 0.96 16.84 -8.49 0.9151 1. 0096 max 14. 71 38.07 56.38 1933 56.08 50.72 15.77 0.30 -0.07 56.38 1.5638 1.003 min -0.02 -8.47 -43.73 1934 4. 42 25.45 -29.97 0.16 10.03 4.58 1.0458 1.0016 1935 44.35 12.56 6.88 0.17 4.98 44.52 1.4452 1.0017 1936 32.44 15.46 28.87 0.18 7.52 32.62 1.3262 1.0018 1937 -34.83 13.92 -4. 89 0.31 0.23 -34.52 0.6548 1.0031 1938 27.95 11.66 -12.8 -0.02 5.53 27.93 1.2793 0.9998 Bin percentage of observations Number of observatoins 1939 2.95 5.28 -17.25 0.02 5.94 2.97 1.0297 1.0002 1940 -6.93 1.38 -1.61 0.00 6.09 -6.93 0.9307 1 T-bills T-bonds Stocks T-bills T-bonds Stocks 1941 -10.14 -4.95 12.16 0.06 0.93 -10.08 0.8992 1.0006 -40.00 -45 to -40 0.00% 0.00% 1.11% 1942 15.75 5.54 19.39 0.27 2.2072 16.02 1.1602 1.0027 -35.00 -40 to -35 0.00% 0.00% 1.11% 1943 28.23 30.65 34.36 0.35 2. 4811 28.58 1.2858 1.0035 -30.00 -35 to -30 0.00% 0.00% 1.11% 0 0 0 0 0 1944 21.12 16.9 17.17 0.33 2.6832 0 0 0 0 21.45 1.2145 1.0033 -25.00 -30 to -25 0.00% 0.00% 2.22% 1945 37.72 26.25 13.72 0.33 5.7924 38.05 1.3805 1.0033 -20.00 -25 to -20 0.00% 0. 00% 1.11% 1946 -6.08 -4.01 2.52 0.35 0. 7415 5.73 0.9427 1.0035 -15.00 -20 to -15 0.00% 0. 00% 1.11% 1947 3.22 -7.51 9.14 0.50 -1. 7798 3.72 1. 0372 1.005 -10.00 -15 to -10 0.00% 0. 00% 7.78% 00 0 0 NOOO 1948 1.33 -8.97 3.3 0.81 3.3228 2.14 1.0214 1.0081 -5.00 -10 to -5 0.00% 8.89% 5.56% 1949 19.23 3.17 -3.54 1.10 6. 4482 20.33 1.2033 1.011 0.00 5 to 0 2.22% 11.11% 3.33% 10 1950 28.26 2.01 26.63 1.20 0. 0569 29.46 1.2946 1.012 5,00 0 to 5 68.89% 37.78% 12.22% 62 111951 19.09 -4.98 -4.84 1.49 -3.9351 20.58 1. 2058 1. 0149 10.00 5 to 10 24.44% 18.89% 5.56% 22 17 1952 11.89 -6.55 3.1 1.66 1.1563 13.55 1.1355 1. 0166 15.00 10 to 15 4.44% 11.11% 8.89% 4 10 1953 -1.15 -1.35 -7.78 1.82 3.6339 0.67 1. 0067 1.0182 20.00 15 to 20 0.00% 7.78% 10.00% -J 1954 49.28 -1.94 24.88 0.86 4. 8513 50.14 1.5014 1. 0086 25.00 20 to 25 0.00% 2.22% 10.00% 1955 23.76 -6.25 5.39 1.57 -1.5332 25.33 1.2533 1.0157 30.00 25 to 30 0.00% 1.11% 10.00% 1956 5.83 -0.67 -2.41 2.46 -4.9255 8.29 1.0829 1.0246 35.00 30 to 35 0.00% 0.00% 8.89% 1957 -13.27 -2.44 6.25 3.14 9.383 -10.13 0.8987 1.0314 40.00 35 to 40 0.00% 1.11% 5.56% 0 0 0 0 0 0 0 0 0 1958 43.46 14.27 12.56 -5. 4536 45.00 0 0 0 POP 1.54 1.45 1. 0154 45.00 40 to 45 0.00% 0.00% 1.11% 1959 9.79 5.64 0.84 2.95 -4.5031 12.74 1.1274 1.0295 50.00 45 to 50 0. 00% 0. 00% 1.11% 1960 -1.73 -2.41 -5.22 2.66 14.4436 0.93 1.0093 1.0266 55.00 50 to 55 0. 00% 0.00% 1.11% 1961 24.88 0. 42 5.56 2.13 -0.026 27.01 1.2701 1. 0213 60.00 55 to 60 0. 00% 0.00% 1.11% 1962 -12.28 -9.25 10.33 2.73 8. 7879 -9.55 0.9045 1.0273 100.00% 100.00% 100.00% 90 90 90 1963 17.92 -6.09 15.42 3.12 1.9938 21.04 1.2104 1.0312 1964 12.66 -1.78 9. 72 3.54 4.1412 16.20 1.162 1.0354 1965 10.58 22.82 5.79 3.93 0.2571 14.51 1.1451 1.0393 1966 -13.54 2.78 -0.94 4.76 4.331 -8. 78 0.9122 1. 0476 1967 24 50.61 9.15 4. 21 -5.3237 28.21 1.2821 1.0421 1968 9.02 24.23 18.06 5.21 2. 4313 14.23 1.1423 1.0521 1969 -17.2 -13.99 -10.71 6.58 -8.3678 -10.62 0.8938 1.0658 1970 -5.65 -11.47 21.58 6.52 18.8552 0.87 1.0087 1.0652 1971 11.65 6.26 -11.39 4.39 14. 4364 16.04 1.1604 1.0439 1972 12.97 -12.24 2.09 3.84 3.9169 16.81 1.1681 1.0384 1973 -24.69 -23.94 17.98 6.93 4.1034 -17.76 0.8224 1.06931974 -35.7 -0.61 9.36 8.00 5.9382 -27.70 0. 723 1.08 1975 32.35 15.04 8.63 5.80 3.9155 38.15 1.3815 1.058 Table 5.5 Excess returns statistics for the market index 1976 21.9 13.8 24.01 5.08 18. 013 26.98 1.2698 1.0508 1977 -8.19 23.24 7.79 5.12 -1.239 -3.07 0.9693 1.0512 Average Std Dev Sharpe Ratio 1978 1.04 14.16 0.47 7.18 -0.5712 8.22 1.0822 1.0718 1926-2016 8. 48 20.29 0.42 1979 13.33 20.4 -2.21 10.38 4.1618 23.71 1.2371 1.1038 1926-1956 11.22 24.75 0.45 1980 22.1 5.59 -24.56 11.24 3.9718 33.34 1.3334 1.1124 1957-1987 5.46 17.91 0.31 1981 -18.05 7.3 24.57 14.71 5.3092 -3.34 0.9666 1.1471 1988-2016 8.88 17.69 0.50 1982 10.78 8.79 13.16 10.54 38.0662 21.32 1.2132 1.1054 1983 14.41 13.94 18.86 8.80 2.3961 23.21 1. 2321 1.088 1984 -4. 76 -8.61 18.63 9.85 13.1978 5.09 1.0509 1.0985 1985 24.63 -0.92 1.16 7.72 27.2103 32.35 1.3235 1.0772 1986 10.41 -10 9.99 6.16 20.193 16.57 1.1657 1.0616 1987 -3.51 -10.39 -2.54 5.47 -2.9299 1.96 1.0196 1.0547 1988 11.55 6.72 13.78 6.35 6.6627 17.90 1.179 1.0635 1989 20.51 -12.01 -5.64 8.37 16.2122 28.88 1. 2888 1.0837 1990 13.84 -14.4 -10.6 7.81 6.872 -6.03 0.9397 1.0781 1991 29.1 16.51 -15.08 5.60 17.9336 34.70 1.347 1.056 1992 6.41 7.78 23.05 3.51 9.0548 9.92 1. 0992 1.0351 1993 8.37 7.47 16.95 2.90 13.4198 11.27 1.1127 1.029 1994 -4.11 0.39 -0.08 3.90 -6. 4083 -0.21 0.9979 1.039 1995 31.04 -6.94 -3.46 5.60 23.9541 36.64 1.3664 1.056 1996 16.25 -1.86 0.22 5.21 0.9946 21.46 1.2146 1.0521 1997 26.07 -3.73 11.14 5.26 11.312 31.33 1.3133 1.0526 1998 19.41 -23.29 -15.03 4.86 13.094 24.27 1.2427 1.0486 1999 20.21 11.66 -39.4 4.68 -8. 4734 24.89 1.2489 1.0468\f
Step by Step Solution
There are 3 Steps involved in it

Get step-by-step solutions from verified subject matter experts