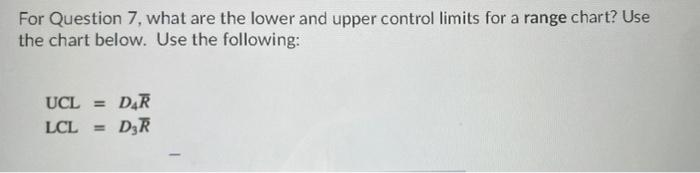
Question: For Question 7, what are the lower and upper control limits for a range chart? Use the chart below. Use the following: UCL = DAR

For Question 7, what are the lower and upper
For Question 7, what are the lower and upper control limits for a range chart? Use the chart below. Use the following: UCL = DAR LCL = DR Factor for Chart, A2 Lower Control Limit D3 Upper Control Limit D4 Number On Observations in Subgroup, n 2 3 4 5 6 7 8 9 10 11 12 13 14 15 16 17 18 19 20 LLLLL 1.88 1.02 0.73 0.58 0.48 0.42 0.37 0.34 0.31 0.29 0.27 0.25 0.24 0.22 0.21 0.20 0.19 0.19 0.18 0 0 0 0 0 0.08 0.14 0.18 0.22 0.26 0.28 0.31 0.33 0.35 0.36 0.38 0.39 0.40 0.41 3.27 2.57 2.28 2.11 2.00 1.92 1.86 1.82 1.78 1.74 1.72 1.69 1.67 1.65 1.64 1.62 1.61 1.60 1.59 O , 87.3, 104.2 45.9, 131.5 34.5, 155.2 O , 32.2, 162.8 D A B 1 Sample # Mean Tim Range 2 1 341 107 3 2 541 96 4. 3 523 118 5 4. 592 93 6 5 341 112 7 6 396 8 7 474 116 9 8 540 63 10 9 374 89 11 10 327 78 12 103

Step by Step Solution

There are 3 Steps involved in it

1 Expert Approved Answer
Step: 1 Unlock blur-text-image
Question Has Been Solved by an Expert!

Get step-by-step solutions from verified subject matter experts

Step: 2 Unlock
Step: 3 Unlock

Students Have Also Explored These Related General Management Questions!