

Question: For the data in the excel file closing stocks prices, do the following Develop spreadsheet models for forecasting each of the stock prices using simple
For the data in the excel file closing stocks prices, do the following
- Develop spreadsheet models for forecasting each of the stock prices using simple 2-period average and simple exponential smoothing with a smoothing constant of 0.3
- Use MAD as guidance and find the best number of moving average period and best smoothing constant for exponential smoothing.
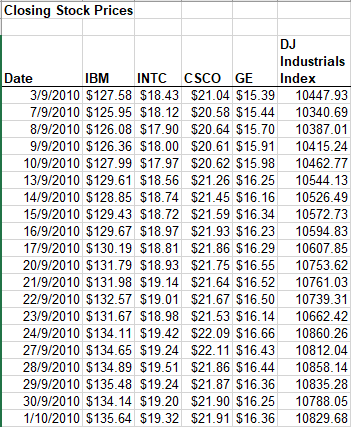
Closing Stock Prices DJ Industrials Date IBM INTC CSCO GE Index 3/9/2010 $127.58 $18.43 $21.04 $15.39 10447.93 7/9/2010 $125.95 $18.12 $20.58 $15.44 10340.69 8/9/2010 $126.08 $17.90 $20.64 $15.70 10387.01 9/9/2010 $126.36 $18.00 $20.61 $15.91 104 15.24 10/9/2010 $127.99 $17.97 $20.62 $15.98 10462.77 13/9/2010 $129.61 $18.56 $21.26 $16.25 10544.13 14/9/2010 $128.85 $18.74 $21.45 $16.16 10526.49 15/9/2010 $129.43 $18.72 $21.59 $16.34 10572.73 16/9/2010 $129.67 $18.97 $21.93 $16.23 10594.83 17/9/2010 $130.19 $18.81 $21.86 $16.29 10607.85 20/9/2010 $131.79 $18.93 $21.75 $16.55 10753.62 21/9/2010 $131.98 $19.14 $21.64 $16.52 10761.03 22/9/2010 $132.57 $19.01 $21.67 $16.50 10739.31 23/9/2010 $131.67 $18.98 $21.53 $16.14 10662.42 24/9/2010 $134.11 $19.42 $22.09 $16.66 10860.26 27/9/2010 $134.65 $19.24 $22.11 $16.43 10812.04 28/9/2010 $134.89 $19.51 $21.86 $16.44 10858.14 29/9/2010 $135.48 $19.24 $21.87 $16.36 10835.28 30/9/2010 $134.14 $19.20 $21.90 $16.25 10788.05 1/10/2010 $135.64 $19.32 $21.91 $16.36 10829.68
Step by Step Solution
There are 3 Steps involved in it

Get step-by-step solutions from verified subject matter experts