

Question: For the data in the table below: i. What do the correlation coefficients of 1, shaded in yellow, indicate? ii. The highest correlation coefficient is
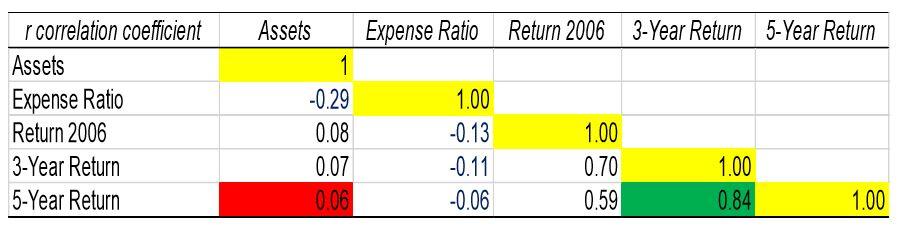
r correlation coefficient Assets Expense Ratio Return 2006 3-Year Return 5-Year Return Assets 1 Expense Ratio -0.29 1.00 Return 2006 0.08 -0.13 1.00 3-Year Return 0.07 -0.11 0.70 1.00 5-Year Return 0.06 -0.06 0.59 0.84 1.00
Step by Step Solution
There are 3 Steps involved in it
1 Expert Approved Answer
Step: 1 Unlock

Solution 1 As per Pearson correlation correlation coefficients indicate the strength o... View full answer
Question Has Been Solved by an Expert!
Get step-by-step solutions from verified subject matter experts
Step: 2 Unlock
Step: 3 Unlock